Biomedical Engineering Reference
In-Depth Information
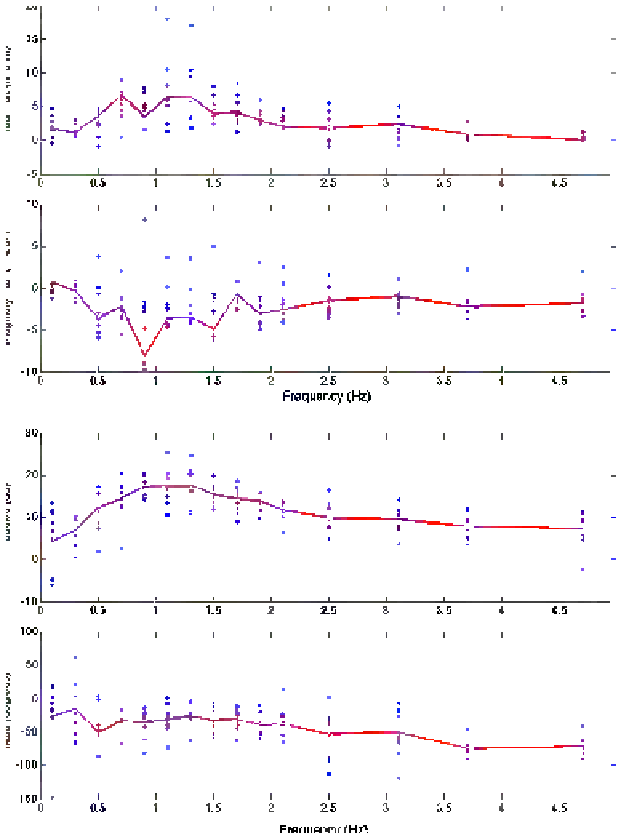
Fig. 9.16
Impedance in its complex representation and its equivalent Bode plot for the asthma di-
agnosed group. The
stars
denote estimated impedance using (
3.8
), while a
continuous line
denotes
the averaged values
in non-linear dynamics and consequently the variations in the non-linear contribu-
tions. This suggests that the proposed index to quantify non-linear distortions is
indeed a valuable tool for diagnosis and follow-up. Of course, a larger population
database needs to be explored for diagnosed patients in order to provide reference
values.