Biomedical Engineering Reference
In-Depth Information
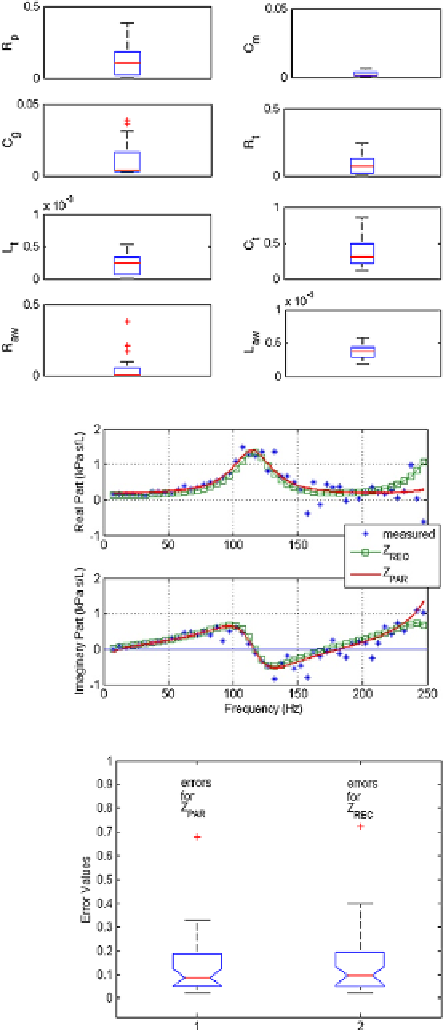
Fig. 7.35
Estimated
parameters of the
Z
PA R
impedance model. Units are,
respectively:
R
p
,R
t
,R
aw
(kPa s/L);
L
t
,L
aw
(kPa s
2
/L);
C
g
,C
m
,C
t
,C
aw
(L/kPa)
Fig. 7.36
Respiratory
impedance by means of its
complex representations;
squares denote the estimated
Z
REC
impedance values;
stars
denote the measured
impedance with (
3.8
),
bold
line
denotes the estimated
Z
PA R
impedance values. This
illustrative example is given
for patient “22” from
Table
7.15
Fig. 7.37
Boxplot for the
total errors provided by the
two identified parametric
models
Z
PA R
and
Z
REC
,
respectively. There were no
statistically significant
differences (
p<
0
.
89)
From the identified recurrent ratios, one can calculate the fractional order of the
ladder network, using (
5.25
). The values are given in Fig.
7.38
as a boxplot showing
the median value and the outliers. In order to check the variability of the fractional-