Biomedical Engineering Reference
In-Depth Information
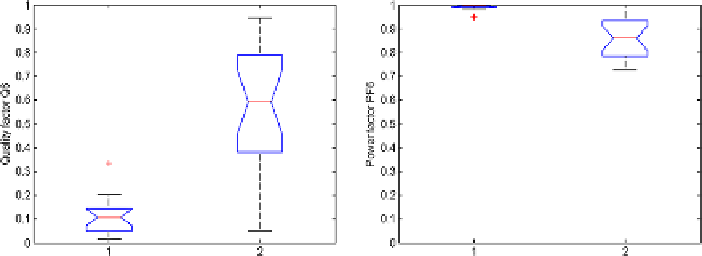
Fig. 7.11
Quality factor
QF
6(
left
) and power factor
PF
6(
right
)in
1
: Healthy subjects and
2
:COPDpatients
Figures
7.9
,
7.10
depict the boxplots for the tissue damping
G
r
(
p
0
.
01), tis-
sue elastance
H
r
(
p
0
.
01), tissue hysteresivity
η
r
(
p
0
.
01) and resistance at
6Hz
R
6(
p
0
.
01) calculated with the parameters from Table
7.7
. In emphysema-
tous lung, the caliber of small airways changes less than in the normal lung (defining
compliant properties) and peripheral airway resistance may increase with increas-
ing lung volume. At this point, the notion of space competition has been introduced
[
64
], hypothesizing that enlarged emphysematous air spaces would compress the
adjacent small airways, according to a nonlinear behavior. Therefore, the compres-
sion would be significantly higher at higher volumes rather than at low volumes,
resulting in blunting or even reversing the airway caliber changes during lung infla-
tion. This mechanism would therefore explain the significantly marked changes in
model parameters in tissue hysteresivity depicted in Fig.
7.10
.
Many alveolar walls are lost by emphysematous lung destruction, the lungs be-
come so loose and floppy that a small change in pressure is enough to maintain a
large volume, thus the lungs in COPD are highly compliant (elastic) [
6
,
64
,
71
].
This is observed in the high values identified for 1
/C
r
.
The quality factor
QF
6 is close to 0.5 in COPD in Fig.
7.11
, suggesting a criti-
cally damped tissue characteristic. As expected, the quality factor remained low in
healthy, denoting the under-damped character of lung parenchyma. This will then
result in a high power factor for healthy and decreased power factor in COPD, hence
increased work of breathing in COPD.
7.3.3 Healthy vs. Kyphoscoliosis
The complex impedance values for the kyphoscoliosis patients obtained using (
3.8
)
are depicted in Fig.
7.12
and the equivalent Bode plots are given in Fig.
7.13
.The
healthy volunteers are the same as in the previous section.
Table
7.8
presents the results obtained from the identification of model param-
eters (
3.10
). There were significant variances between the groups for tissue damp-
ing
G
r
(
p
0
.
01), but not for tissue elastance
H
r
(
p<
0
.
75), as observed from