Biomedical Engineering Reference
In-Depth Information
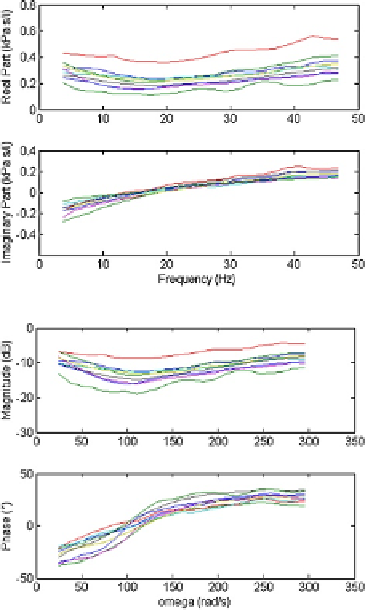
Fig. 7.12
Impedance plots
for the kyphoscoliosis group
Fig. 7.13
Bode plots for the
kyphoscoliosis group
Ta b l e 7 . 8
Estimated and derived model parameters and modeling errors for the healthy and
kyphoscoliosis groups. Values are given as mean
±
standard deviation; values in brackets indi-
cate the 95 % confidence intervals
Healthy
Kyphoscoliosis
L
r
0
.
032
±
0
.
029 (0.019, 0.045)
0
.
0173
±
0
.
012 (0.007, 0.02)
1
/C
r
1
.
59
±
1
.
10 (1.09, 2.08)
2
.
47
±
0
.
76 (1.85, 3.10)
0
.
42
±
0
.
08 (0.38, 0.47)
0
.
54
±
0
.
05 (0.49, 0.58)
α
r
±
±
β
r
0
.
75
0
.
11 (0.70, 0.80)
0
.
55
0
.
05 (0.50, 0.59)
G
r
0
.
44
±
0
.
15 (0.37, 0.50)
1
.
55
±
0
.
39 (1.25, 1.86)
H
r
1
.
49
±
1
.
14 (0.98, 2.00)
1
.
91
±
0
.
73 (1.34, 2.48)
η
r
0
.
41
±
0
.
21 (0.32, 0.51)
0
.
85
±
0
.
16 (0.72, 0.98)
R
6
0
.
13
±
0
.
05 (0.11, 0.16)
0
.
28
±
0
.
06 (0.23, 0.33)
Frez
10
.
48
±
3
.
56 (8.75, 13.87)
15
.
01
±
2
.
08 (12.80, 18.02)
QF
6
0
.
09
±
0
.
09 (0.02, 0.17)
0
.
58
±
0
.
15 (0.46, 0.71)
PF
6
0
.
99
±
0
.
01 (0.98, 0.99)
0
.
85
±
0
.
05 (0.81, 0.90)
E
R
0
.
02
±
0
.
01
0
.
03
±
0
.
008
E
X
0
.
013
±
0
.
006
0
.
01
±
0
.
005
E
T
0
.
02
±
0
.
01
0
.
03
±
0
.
008