Biomedical Engineering Reference
In-Depth Information
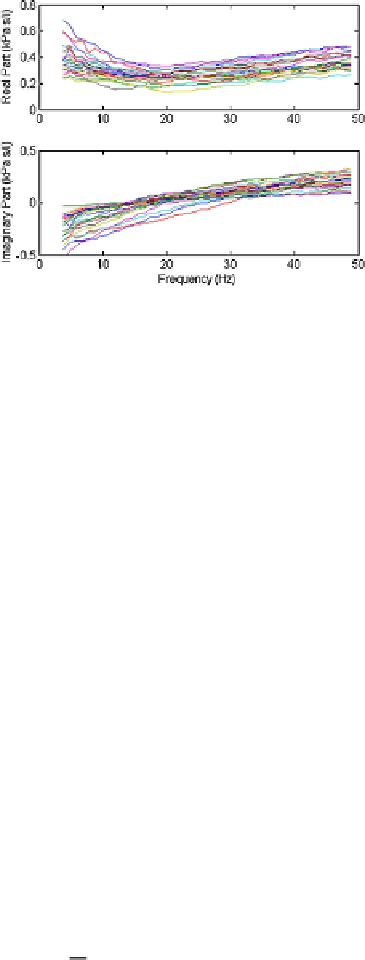
Fig. 7.2
Impedance plots for
the COPD group
algorithm). The estimated parameter values along with the modeling error values are
given in Table
7.2
for the healthy subjects, respectively in Table
7.3
for the COPD
patients.
Independent Student's
t
tests with unequal sample size were used to compute the
confidence intervals. The classification results were considered significant if
p
≤
0
.
05 (i.e. within 95 % confidence interval).
The model parameters were compared between groups using
boxplots
.The
lower and upper lines of the boxplot are the 25th and 75th percentiles of the sample
group. The distance between the top and bottom of the box is the interquartile range.
The line in the middle of the box is the sample group median value. If the median
is not centered in the box, it is an indication of skewness. The whiskers are lines
extending below and above the box. They show the extent of the rest of the sample
group (unless there are outliers). Assuming no outliers, the maximum of the sample
is the top of the upper whisker, respectively, the minimum is the bottom of the
lower whisker. An outlier is a value more than 1.5 times the interquartile range
away from the top or bottom of the box, and they are denoted by plus signs. A side
by side comparison of two or more boxplots provides a graphical way to determine
which groups have significantly different medians (typical measure in classification
studies).
From the model parameters, one can calculate the tissue damping
G
r
=
1
C
r
cos
(
2
β
r
)
and tissue elastance
H
r
=
1
C
r
sin
(
2
β
r
)
[
57
] and tissue hysteresivity
η
r
=
G
r
/H
r
[
42
]. The relationship with (
7.2
) is found if the terms in
C
r
are re-
written as:
cos
π
2
β
r
sin
π
2
β
r
1
C
r
ω
r
1
C
r
ω
r
G
r
−
jH
r
ω
r
−
j
=
(7.11)
From Tables
7.2
and
7.3
one may observe that the model FO4 gives the smallest
total error. This is due to the fact that two FO terms are present in their model struc-
ture, allowing both a decrease and increase in the real part of the impedance values.
The FO2 model is the most commonly employed in clinical studies, with similar
errors for the imaginary part, but higher error in the real part of the impedance than
the FO4 model. The underlying reason is that the model can only capture a decrease