Biomedical Engineering Reference
In-Depth Information
Ta b l e 7 . 1
Biometric and
spirometric parameters of the
investigated subjects. Values
are presented as mean
Healthy
(17)
COPD
(17)
±
standard deviations; % pred:
predicted according to the
asymptomatic males of the
study;
VC
: vital capacity;
FEV
1
: forced expiratory
volume in one second
±
±
Age (yrs)
26
3
51
11
Height (m)
1
.
67
±
0
.
04
1
.
74
±
0
.
09
Weight (kg)
64
±
3
.
7
76
±
8
VC
%pred
-
89
±
7
FEV
1
%pred
-
44
±
6
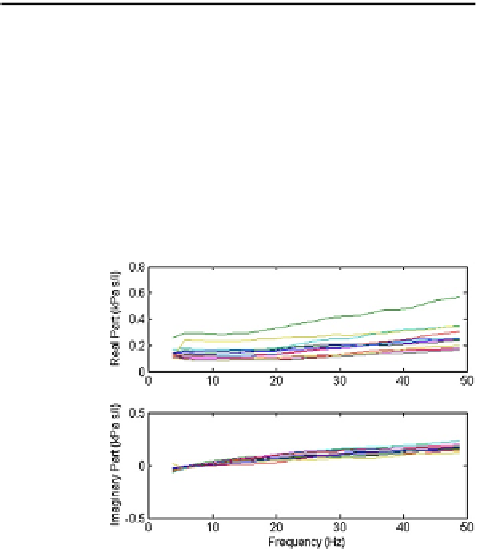
Fig. 7.1
Impedance plots for
the healthy group
Romania, and diagnosed with COPD (Chronic Obstructive Pulmonary Disease). Ta-
ble
7.1
presents the corresponding biometric and spirometric parameters.
The measurements of the input impedance values for these two groups of vol-
unteers have been performed according to the forced oscillation lung function test
described in Sect.
3.1
and the model from (
3.8
). The modeling errors have been
calculated according to (
3.12
).
7.2.3 Results
The complex impedance values for the healthy and COPD patients have been ob-
tained using (
3.8
) and they are depicted in Figs.
7.1
and
7.2
. It can be observed that
the healthy group has a resonant frequency (zero crossing in the imaginary part)
around 8 Hz, whereas the COPD group around 16 Hz. The real part denotes mainly
the mechanical resistance of the lung tissue, which is generally increased in the
COPD group, resulting in higher work of breathing. Also, the resistance at low fre-
quencies is much increased in the COPD group, suggesting increased damping of
the lung parenchyma [
64
].
Next, the models from (
7.1
)-(
7.5
) are fitted to these complex impedance values.
Identification is performed using the System Identification Toolbox within the Mat-
Lab platform, i.e. the
lsqnonlin
optimization function (a nonlinear least squares