Biomedical Engineering Reference
In-Depth Information
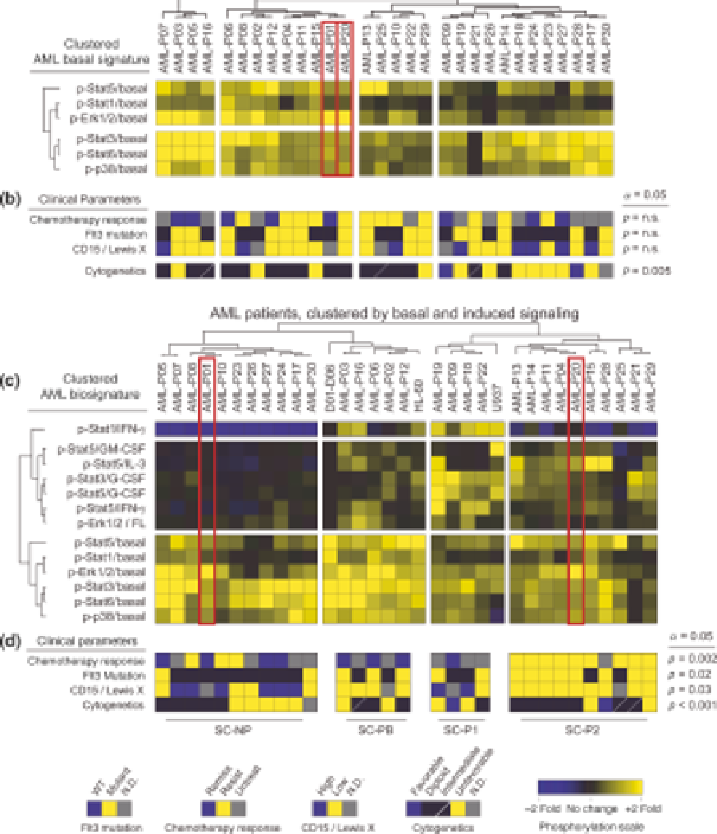
FIGURE 15.8
Measuring induced signaling responses provides clinically useful information
on disease signaling networks. (a) Shown are 30 AML cancer patients clustered by the basal level
of phosphorylation measured in the AML cell population. Large differences in basal phosphor-
ylation were observed among the patient samples. Four groups of patients were defined using this
profile of basal signaling only. Note patients P01 and P20, whose AML cells displayed extremely
similar basal signaling. (b) Key clinical features, including the initial response to induction
chemotherapy, FLT3 mutation status, CD15 expression, and cytogenetics of the 30 patients from
(a). Basal signaling stratified the cytogenetics of the patients, but not initial chemotherapy
response, CD15 expression, or FLT3mutation status. (c) Additional data on the induced signaling
response of the same 30 patients are shown. Strikingly, the addition of signaling responses reveals
differences betweenAML-P01 andAML-P20.Many induced signalingeventswerepotentiated in
AML-P01. (d) The same clinical parameters as in (b) are now shown for the patients, as grouped in
(c), according to both basal and induced signaling. Potentiated signaling responses now
significantly stratify all four clinical parameters: chemotherapy response, FLT3 mutation status,
CD15expression, andcytogenetics. (See the color versionof thefigure in theColor Plates section.)
Search WWH ::

Custom Search