Biomedical Engineering Reference
In-Depth Information
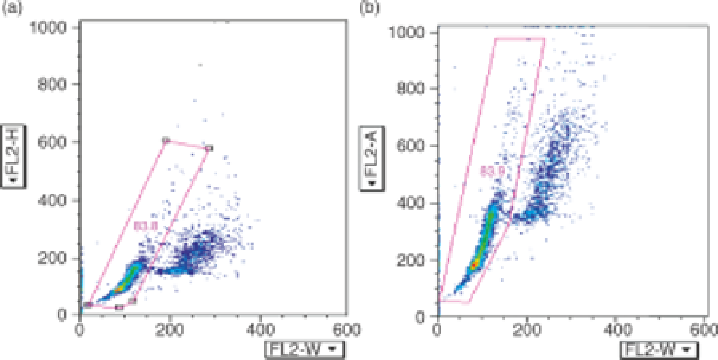
FIGURE 5.2
Gating strategies to remove doublets and other clumping cells. (a)Width versus
height and (b) width versus area discrimination in the FACSCalibur (BD).
we will be referring to another one included in Flowjo software. See Section 5.2.3 for
details.
5.2.3 The Technologies
When evaluating DNA as a marker for cellular proliferation and cell cycle traverse
times (from commitment to divide to the end of DNA synthesis and completion of one
division cycle), there are some tools available that provide algorithms to quantify the
data in the formof a standard cell cycle profile. Nevertheless, since cells are a dynamic
population and their interaction with agents (compounds or biological agents) will
result in a variable response inherent to the cell, we need to consider some details.
Examples include what information can the standard cell cycle profile provide, what
kind of variability can be expected when we go beyond the standard profiles from
theory to practical observations (see Figure 5.3), and what can we do to improve our
interpretation of the data. For this last idea, the easiest approach is to capture
additional data about other biomarkers that can provide more complete information
FIGURE 5.3
Variability expected in standard cell cycle profiles of cells growing at different
speed rates (doubling times) from left to right with fast growing cycling in less than 24 h.

Search WWH ::

Custom Search