Biomedical Engineering Reference
In-Depth Information
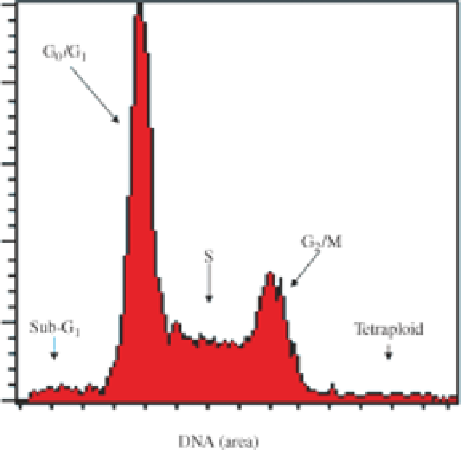
FIGURE 5.1
Standard cell cycle profile histogram.
individual cells, the standard procedures allow preservation of most of cells
undergoing apoptosis that otherwise would be lost.
To analyze DNA content in individual cells, as seen in Figure 5.1, we need to start
using single-cell suspensions. Unfortunately, most of the procedures for preparing
individual cells from tissues or cell culture monolayers have one disadvantage, the
presence of a certain number of cells as clumping clusters that need to be discarded in
the data processing steps, since they will interfere with the DNA measurements that
span only between 2N and 4N DNA content levels. The advantage of this kind of
methodology is that all signals are exclusively associated with individual particles
regardless of size and shape and the presence of clusters can be identified by
commercially available software, thus giving the investigator the possibility to
electronically eliminate clumps of multiple cells from the data pool.
Unfortunately, this crucial simple step is frequently ignored by the experimenter at
the time when DNA cell cycle profiles are created during analysis. The cleanup
procedure to eliminate these aberrant populations is embedded in the software
alternatives as two kinds of gating strategies: the width versus area discrimination
and the height versus area discrimination (see Figure 5.2). Despite several opinions in
the literature, either approach seems to work with equal efficiency, and it is only a
matter to select one approach and stick with it.
5.2.2.2 Cell Cycle Analysis Algorithms After a single-cell population has been
electronically selected, traditional cell cycle analysis algorithms are applied from the
included software in analytical packages for flow cytometry. Shapiro mentioned a
couple of these programs specially linked to clinical applications [8]. In this chapter
Search WWH ::

Custom Search