Information Technology Reference
In-Depth Information
•
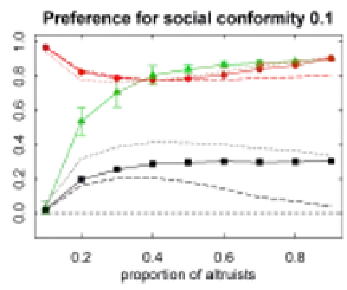
Agents' achieved social conformity as the mean value of their perceived social
conformity (red) and the respective means for altruistic and egoistic agents (dashed
respectively dotted red).
•
The success of the collective action as the mean value of all groups (green).
In the diagrams, we compare the performance of heterogeneous populations with
increasing social conformity preference. To assess performance we calculate means of
the performance indicators during the last 200 steps for each run. In the diagrams we
show the mean values of these aggregations and standard deviations of the 20 initiali-
sations used.
Fig. 2.
Aggregated results for different population compositions and different preferences for
social conformity. For each run performed we calculate mean values of the performance indica-
tors during the last 200 simulation steps. The error bars show the standard deviation of the
mean values of the 20 runs performed for a distinct parameter setting. See text for further ex-
planation. Adapted from [1].
Unsurprisingly, in all three diagrams of Fig. 2 we observe that the success of the
collective action generally increases with increasing proportion of altruists. However,
significant differences exist depending on preference weight of social conformity. For
the lowest setting for social conformity we observe that when the proportion of altru-
ists is at least 0.2 the success of the PG provision reaches high levels. Even if 90% of
the population are egoists, a moderate PG level of around 0.6 is provided. When the