Environmental Engineering Reference
In-Depth Information
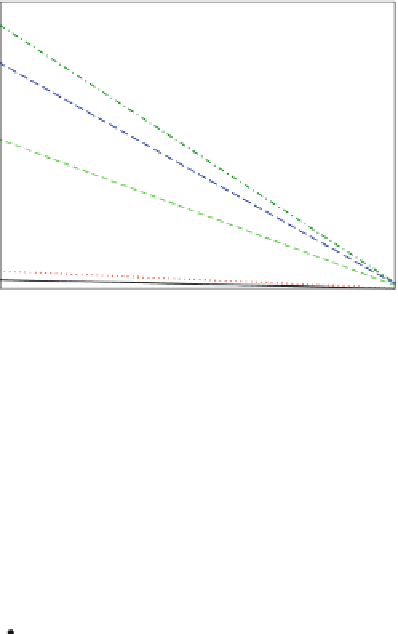
Fig. 14
Velocity profile for
the linear Couette flow
simulations for different wall
velocities (shear rate). The
velocity is scaled with the
dynamic scale of a polymer
melt of the same density as
the brush
D
w
D
5*ˁ
melt
v
w
=0.06
v
w
=0.12
v
w
=1.00
v
w
=1.50
v
w
=1.75
12
*
=13.40
ˁ
10
8
R
e
,where
D
w
is the channel width,
D
the diffusion coefficient of
the equivalent polymer melt
and
R
e
its end-to-end
distance. The
open squares
show the density profile of
the same system. It should be
noted that it is highly
independent of the flow
conditions. Adapted from
Pastorino et al. (
2009
)
/
6
4
2
0
3
4
2.5
3.5
4.5
5
12
*
=35.10
ˁ
10
8
6
4
2
0
4
3.5
4.5
5
z/R
e
In these examples, the Couette (linear) flow is established by moving the walls
of the polymer-coated channel at constant and opposite velocity. This builds up, at
stationary regime, a linear velocity profile in the channel with 0 velocity exactly at
the center of the channel.
A typical simulation is shown in the inset of Fig.
13
. The Figure shows a density
profile with the two species in the system: a polymeric liquid of ten-bead chains
(gray) which is confined between two layers of end-grafted polymers, a polymer
brush (red). The densities show the brush-liquid interfaces clearly defined. The liquid
is not able to enter in the brush layer, even when all the interactions are attractive, due
to entropic effects (Pastorino et al.
2007
,
2009
). This corresponds to the well-known
case of autophobicity (Pastorino et al.
2006
). The brush thickness depends on the
grafting density (number of chains per unit area grafted at the wall). This system can
be studied in equilibrium and also under flow.
The velocity profiles obtained as a result of moving the wall at constant and oppo-
site velocity are shown in Fig.
14
. The linear velocity profiles are clearly observed
for two different grafting densities in the brush (upper and lower panels). The density


Search WWH ::

Custom Search