Environmental Engineering Reference
In-Depth Information
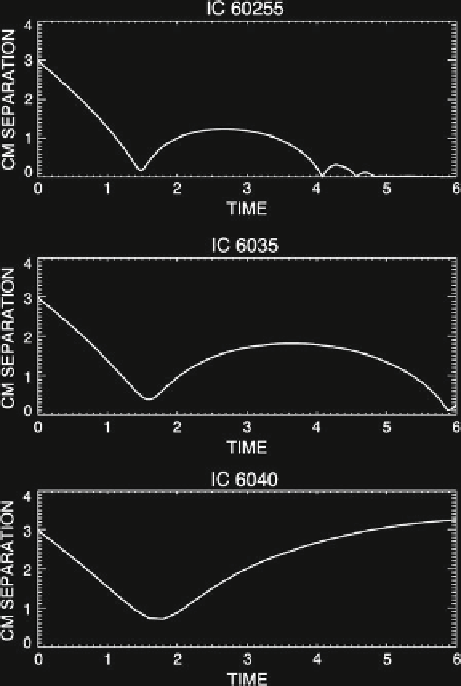
Fig. 2
Evolution of the
center of mass separation.
The figure corresponds to
p
=
0
.
1(
top panel
),
p
=
0
.
3
(
middle panel
), and
p
=
0
.
6
(
bottom panel
)
3 Results
All collision models have
N
=
552
,
550 total particles. We consider three sets of
simulations followed up to time
t
=
1
.
56 Gyr. The sets are defined by the impact
parameter. First set is for
p
=
0
.
1, the second is for
p
=
0
.
3, and the third is for
6. The proportion of galaxy masses is 1:1. See Table
2
for more details. We
compute the evolution of the relative differences, through the whole simulations:
|
(
p
=
0
.
, where
E
0
and
L
0
are total energy and
magnitude of total angular momentum at the beginning of the simulation and
E
E
(
t
)
−
E
0
)/
E
0
|
and
|
(
L
(
t
)
−
L
0
)/
L
0
|
(
t
)
and
L
are the corresponding quantities as functions of time. All models show
a good energy and angular momentum conservation. The relative error is at most
≈
(
t
)
8 % for the total angular momentum.
In order to detect the presence of a bar in a galaxy and to characterize quantitatively
its amplitude, we use the following method. We compute isodensity curves of the
disc in a 128
0
.
4 % for the total energy and
≈
0
.
×
128 mesh, i.e., a contour map of the density field around the center of
Search WWH ::

Custom Search