Environmental Engineering Reference
In-Depth Information
on the dimensionless vertical coordinate z. The distribution obtained experimentally
(dashed line) is compared with the numerically obtained solution of Kurdyumov and
Liñán (
2001
) (solid line). The experimental curve corresponds to the case depicted
in the snapshot 6 of Fig.
3
.
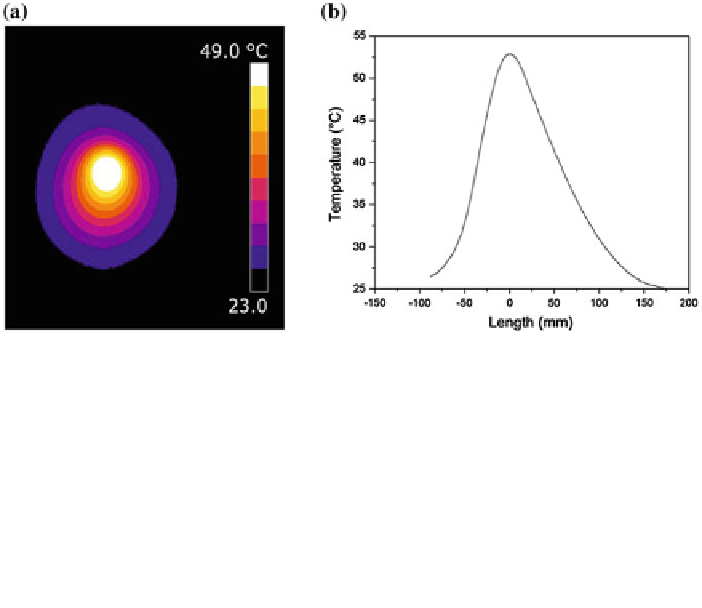
Fig. 5 a
Infrared image showing the plume shape due to forced convection induced from the
upper
part
of the saturated porous medium.
b
Plot showing the temperature distribution as a function of
the distance (length taken with reference to the
vertical z
-axis passing through the heat source)
Fig. 6 a
Infrared picture showing the plume formed due to forced convection induced from the
lower part
of the saturated porous medium.
b
Plot showing the temperature distribution as a function
of the distance (length taken with reference to the
vertical z
-axis passing through at the heat source)

Search WWH ::

Custom Search