Environmental Engineering Reference
In-Depth Information
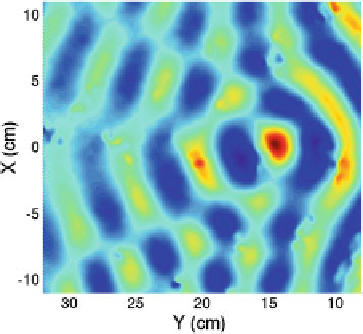
Fig. 8
Wave field in which breaking is developing. The wave frequency is 7Hz. The amplitude
increases monotonically before y
=
15 cm. After this point the wave becomes divergent. During
the wave breaking a fraction of the energy is dissipated
measured the free surface topography for
y
30 cm with the synthetic Shlieren
method. The result presented in Fig.
7
, corresponds to a wave of frequency f
>
=
10Hz (
4 cm). An important feature is that, as wave progresses the amplitude
decreases and nonlinear behavior weakens. In fact, skewness and asymmetry have
the following values at y
ʻ
=
2
.
=
40 cm:
A
s
=
0
.
06 and
S
=−
0
.
02, whereas the same
quantities take the values
A
s
34 cm. This is a proof
that far from the caustics the wave is well described by the linear theory.
In order to produce wave breaking, a higher amplitude is required. In Fig.
8
we
show a snapshot of the wave field in which breaking develops. We remark two
facts: (a) the nonlinear interactions lead to a greater ratio of maximal to initial am-
plitudes (the amplitude at the wave maker) when compared with results shown in
Figs.
5
,
6
and
7
and (b) the position of maximal wave amplitude is
y
=
0
.
16 and
S
=−
0
.
04 at y
=
15 cm, some
wavelength before the Huygens cusp.The shape of the wave fronts is clearly mod-
ified by the breaking. First at all the wave appears as divergent for
y
=
>
15 cm. In
addition, just before
y
15 cm the growth of wave develops rapidly over a distance
comparable to a wavelength. In Fig.
9
the wave along the symmetry axis (
x
=
=
0) is
shown. Before
y
15 cm the amplitude grows monotonically but after this point the
wave exhibits important modifications. For instance the peaks located at
y
=
=
26 cm
and
y
30 split in two local maxima. Finally it is important to say that the decrease
of the amplitude during the breaking reveals that energy is dissipated.
Now we present some results of the numerical simulations. All the wave maker
characteristics are retained and the driving frequency is again 7Hz. In Fig.
10
we
show snapshots of both linear (Fig.
10
a) and nonlinear waves (Fig.
10
b). For a linear
wave the initial amplitude is irrelevant (only the ratio of the actual to initial amplitude
is important), but the same does not apply for a nonlinear wave. In the simulations,
initial amplitude is 2% of the liquid depth. The overall trend of wave fronts is
qualitatively the same in both cases. In Figs.
10
a, b interference holds either inside
=

Search WWH ::

Custom Search