Environmental Engineering Reference
In-Depth Information
0.6
0.4
0.2
0
−0.2
−0.4
30
25
20
15
10
Y (cm)
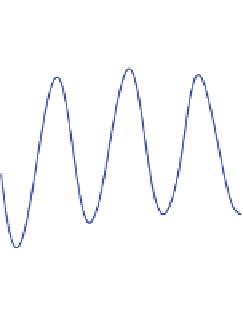
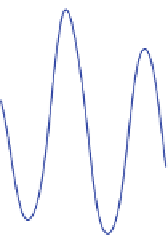
Fig. 6
Monochromatic wave of f
=
7Hz produced by a parabolic wave maker along the symmetry
axis. Wave progresses from
right
to
left
. The asymmetry of the wave reveals that nonlinearities are
important
there is a change of sign of the wavefront curvature, so waves become divergent.
Consequently the further evolution leads to a decrease of the wave amplitude.
Taking into account that the maximal value of surface deformations occurs along
x
0, in Fig.
6
we show the curve h versus y along the symmetry axis. The maximal
amplitude occurs at
y
=
27 cm, after passing the cusp, in agreement with results by
Pearcey. A key feature of Fig.
6
is the asymmetry of the wave. This is a signature
of a nonlinear behavior. For
y
=
27 cm the wave amplitude decreases because wave
becomes divergent. In order to follow evolution of such divergent waves we have
>
0.06
0.04
0.02
0
−0.02
−0.04
−0.06
40
38
36
34
32
Y (cm)
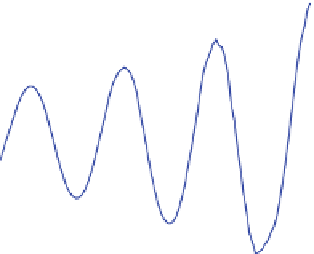
Fig. 7
Wave field of a monochromatic wave of f
=
10Hz produced by a parabolic wave maker. The
topography of the free surface was obtained with the synthetic Schlieren method. Wave progresses
from
right
to
left
.Aty
=
40 the values of skewness and asymmetry are respectively 0.06 and
−
0.02.
At y
=
34 cm these quantities take the following values
A
s
=
.
16 and
S
=−
.
0
0
04


Search WWH ::

Custom Search