Graphics Reference
In-Depth Information
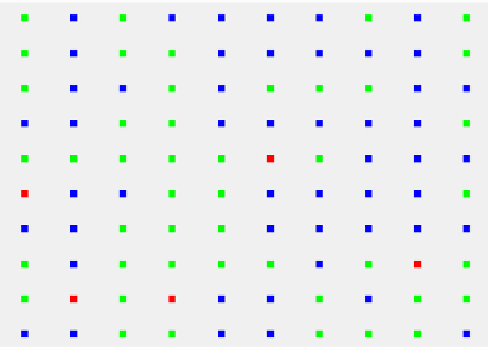
A visual simulation test scene was designed with 100 entities that are divided into 3
types: 5 helicopter, red, visual field is 8000m; 45 tanks, blue, visual field is 2500m; 50
Armored cars, green, visual field is 1800m. During DIS process, they need commu-
nication with each other. In order to getting convenience, in this research paper, we
select the interaction data flow of the time t to conduct comparing study. Selecting node
A (x, y) at will as the sender, send 1 time per second.
First: No matter how the visual field range is for each entity, entity A sends one data
package to other 99 entities.
Second: A computes distance between itself with other 99 entities, if a distance is in
the visual of field range of certain receiver, the receiver is selected as the communica-
tion target for A, then A can send data package to the selected entity. For example, the
distance between A and B (B is helicopter) is 3000m, which is smaller than visual of
field of helicopter (8000m), so A can send a state data package of itself to B during this
network communication.
Figure 6 shows the distribution of 100 entities.
Fig. 6
. 100 entities position distribution(1000m between two entities)
Table 1 gives the two results of the network data flow load which has been produced
by the communication interaction.
According to above results, the network data flow load of first communication in-
teraction experiment (that has no relation with entity node visual field range) is bigger
than the second experiment (which use the visual field partition interaction range)
approximately more than 20 times. In large scale visual simulation scene, with the
increasing of entity quantity, the effect of reduce flow by using this solution will be
more obvious.


Search WWH ::

Custom Search