Geology Reference
In-Depth Information
(a)
(b)
39.0
39.0
38.5
38.5
38.0
38.0
37.5
37.5
37.0
37.0
36.5
36.5
0
0.002
0.004
0.006
0.008 0.010
Cycles/kyr
0.012
0.014
0.016
0.018
0.02
0 .002 0.004 0.006 0.008 0.010
Cycles/kyr
0.0120.014
0.0160.018 0.02
(c)
39.0
38.5
38.0
37.5
37.0
36.5
0
0.002 0.004 0.006 0.008 0.010
Cycles/kyr
0.012 0.014 0.016 0.018 0.02
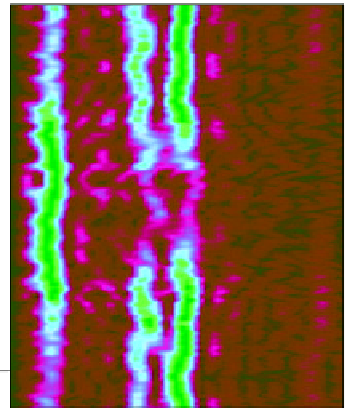
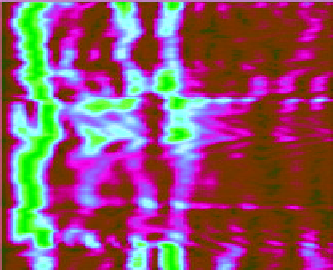
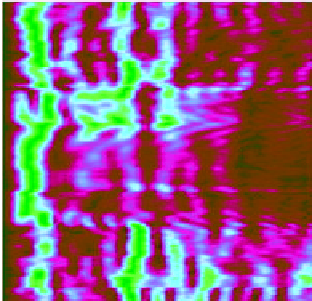
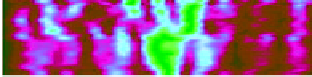
Figure 4.24
Evolutionary spectrograms over f = [0, 0.02 cycles/kyr] of (a) La2004 eccentricity, (b) 2-iteration
eccentricity-tuned Arguis ARM series (see also power spectrum in Figure 4.22a), and (c) 2-iteration then
precession index-tuned Arguis ARM time series (see also power spectrum in Figure 4.22b) from 36 to 40 Ma
(details in Chapter 5). An 800 kyr window was used, stepping through the series at 5 kyr intervals, calculating the
unsmoothed periodogram. Each periodogram is normalized to itself, which helps to track the evolution of the
major spectral components of each window. The y-axis displays the first periodogram at 36 Ma and the last
periodogram at 40 Ma - 0.8 myr = 9.2 Ma. Each contributing spectrum has been normalized to itself, in order to
track the major contributing spectral components throughout the time series. These spectrograms were computed
with
evofft.m
(see Appendix).