Geoscience Reference
In-Depth Information
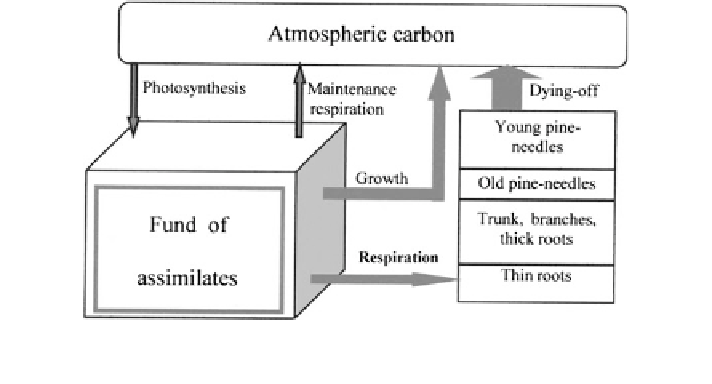
Fig. 8.12 The conceptual scheme of the carbon cycle in the model of the production process in
the coniferous forest (Kirilenko 1990)
The output variables are photosynthesis, average height and diameter of trees,
transpiration, respiration, increment of the tree
s organs, and other characteristics of
the coniferous forest ecosystem calculated in the model.
The biomass of the phase variables in the model is measured in carbon units, and
the respective scheme of carbon
'
fluxes is shown in Fig.
8.12
. The notations for
dynamic equations are the following:
fl
s
3
(m
3
) is the area of the trunks per m
2
of soil;
ʸ
i
(
˄
B
) is the function of distribution of assimilates, that is, the share of the fund
of assimilates spent on the increment of the ith organ;
˄
B
is the biological time;
d
i
is the share of the dead biomass of the ith organ (i =1,
…
, 4);
F is a photosynthesis value;
r
i
is the respiration intensity of the growth of the ith organ; and
p
i
is the respiration intensity of the maintenance of the ith organ.
The process of photosynthesis can be parameterized using the Chartier formula:
q
ð
C
0
r
F ¼
rð
T
L
ÞXðx
S
Þ
2
ð
r
r
c
Þ
S
L
2
s
2
C
0
þ
r
a
E
a
E
Þ
þ
4r
c
a
EC
0
;
where
(T
L
) is a function of the dependence of photosynthesis intensity on the leaf
temperature T
L
; S
L
=
˃
x
S
is the weighted-mean soil
ʲ
m
L
is the area of pine-needles;
X xðÞ
is the function of the impact of the over-moistened root-layer of
the soil on photosynthesis; r ¼ r
a
þ
r
st
þ
r
c
;
moisture;
r
a
and r
st
are diffuse resistances for
CO
2
molecules in the leaf boundary layer and in the leaf stoma, respectively, r
c
is
an ef
cient resistance of carboxylizing;
˄
is the duration of the light period of day;
ʱ
is an initial angle of inclination of the light curve of photosynthesis:
Search WWH ::

Custom Search