Geoscience Reference
In-Depth Information
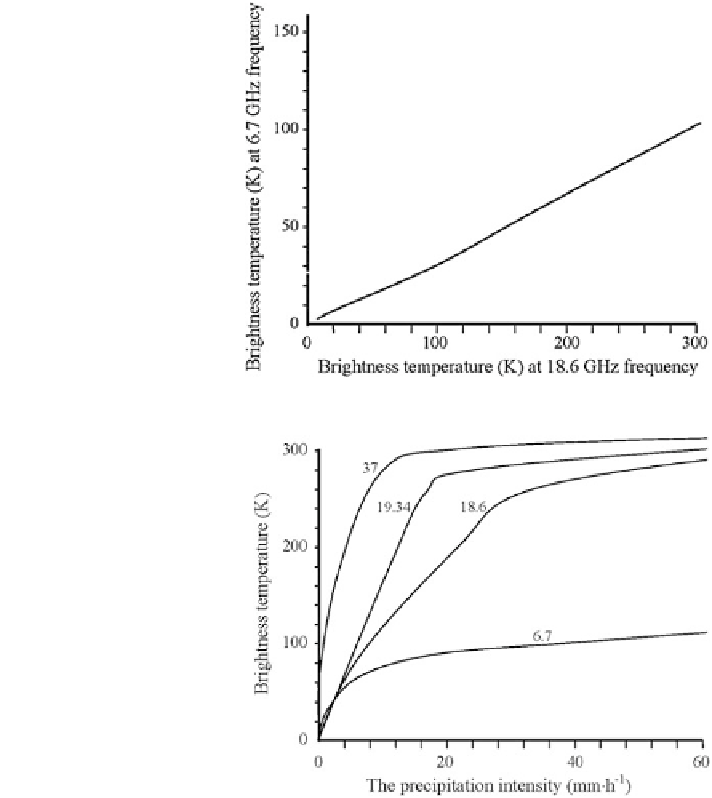
Fig. 2.28 The state image of
informational space of
brightness temperatures in the
section of the most
representative frequencies
Fig. 2.29 The comparative
rainfall rate dependence of the
sky brightness temperature for
different frequencies (they are
shown on the curves, GHz)
(Sasaki et al. 1989)
of these parameters using data about signal absorption and
fl
fluctuation as a result of
propagating along the changing tracks between satellites.
The in
fl
uence of the atmosphere and ionosphere on the parameters of refraction,
fl
fluctuation, relaxation, absorption, decay, and change in signal frequency has been
studied in detail. Depending on the orbit position of the satellite this in
uence
makes it possible to receive data about the atmosphere and ionosphere in concrete
regions of the planet. A total spatial image for part or of the atmosphere can be had
by data processing using GIMS technology.
It is possible to distinguish between the direct and inverse tasks of radio-
translusense. The direct task arises when the atmosphere model is used to determine
the above mentioned changes in electromagnetic waves for a given satellite
fl
Search WWH ::

Custom Search