Biology Reference
In-Depth Information
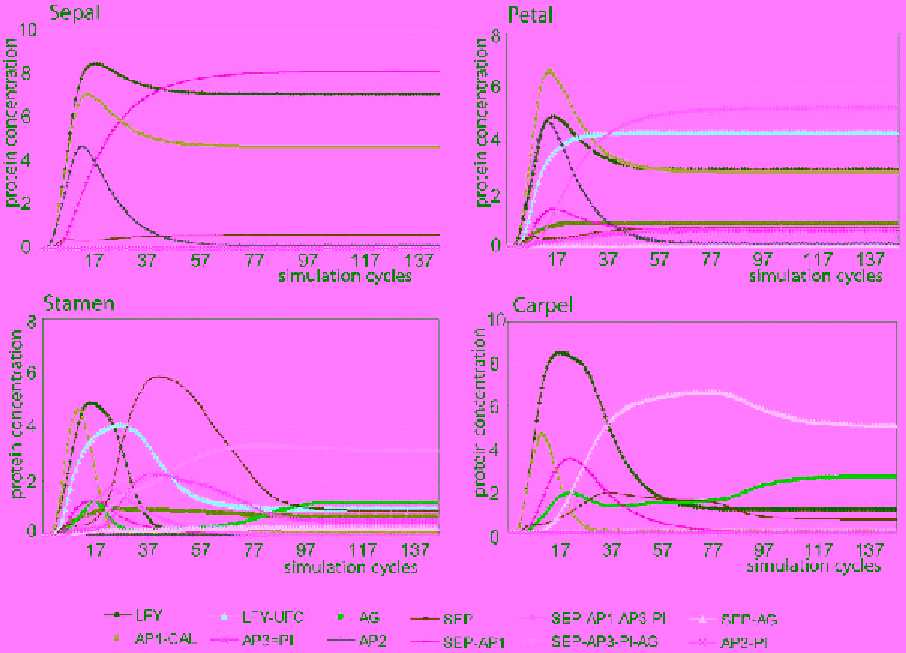
Fig. 4. Simulation results for each of the 4 types of floral organs, dependent on the initial conditions described in the methods.
The expression (Y axis) corresponds to a protein concentration value (arbitrary units), and time corresponds to the simulation
cycle number. The color coded lines correspond to single and complex factors as described in the bottom table. In every case,
the highest expression value in the steady state corresponds to the complex known to be responsible for the differentiation of
each organ.
RESULTS
Network simulation
The network was simulated under the 4 initial conditions described above, until the expression levels
of the proteins reached a steady state (Fig. 4). The relative protein expression levels of each simulation
are in accordance with those currently known for each floral organ, and provide a qualitative description
of the dynamics behind the specification of floral organ identities [Krizek and Fletcher, 2005]. Figure 4
presents results of simulations for each type of floral organ. In all cases, the higher-order protein
complex specific for a certain type of floral organ can be recovered as the predominant component in
the system after reaching the equilibrium. According to the simulation, the petal and sepal identity
factor AP1(/CAL) is transiently expressed during carpel- and stamen initiation, leading also to transient
formation of high-order complexes involving these proteins. This is consistent with experimentally
determined mRNA and protein expression patterns indicating that AP1 is found in all floral whorls at
the earliest stages of flower development [Mandel
et al.
, 1992; Urbanus
et al.
, 2009], and reflects the