Biology Reference
In-Depth Information
tt0
tt1
tt2
tt3
tt4
tt5
tt6
tt7
tt8
tt9
tt10
tt11
tt12
tt13
tt14
tt15
tt16
tt17
tt18
tt19
tt20
tt21
tt22
tt23
tt24
tt25
tt26
tt27
tt28
tt29
tt30
tt31
tt32
tt33
tt34
tt35
tt36
tt37
tt38
tt39
tt40
tt41
tt42
tt43
tt44
tt45
tt46
tt47
tt48
tt49
tt50
tt51
tt52
tt53
tt54
tt55
tt56
tt57
tt58
tt59
tt60
tt61
tt62
tt63
tt64
tt65
tt66
tt67
tt68
tt69
tt70
tt71
tt72
tt73
tt74
tt75
tt76
tt77
tt78
tt79
tt80
tt81
tt82
tt83
tt84
tt85
tt86
tt87
tt88
tt89
tt90
tt91
tt92
tt93
tt94
tt95
tt96
tt97
tt98
tt99
tt100
tt101
tt102
tt103
tt104
tt105
tt106
tt107
tt108
tt109
tt110
tt111
tt112
tt113
tt114
tt115
tt116
tt117
tt118
tt119
tt120
tt121
tt122
tt123
tt124
tt125
tt126
tt127
tt128
tt129
tt130
tt131
tt132
tt133
tt134
tt135
tt136
tt137
tt138
tt139
tt140
tt141
tt142
tt143
tt144
tt145
tt146
tt147
tt148
tt149
tt150
tt151
tt152
tt153
tt154
tt155
tt156
tt157
tt158
tt159
tt160
t103
t107,t108
t112
t115
T-invariants
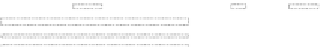
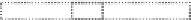
Fig. 11. Color map to visualize which transitions (reactions) occur within similar pathways (T-invariants) through the network.
The similarity can be compared via the dendrogram at top of the figure, which is the same as shown in Fig. 10. Dark (light)
colors indicate presence (absence) of one or several reactions among the total set of modeled reactions within one or several
T-invariants. The red dashed rectangles show an example of groups of T-invariants, which specifically lack the reactions
indicated at the right side. Note that these groups of T-invariants appear in different clusters and their common feature is
easier detectable via the color map compared to the dendrogram.
(Colours are visible in the online version of the article at
ways without an explicit efflux reaction might constitute an intermediate process to reach such levels.
Another explanation, which is not reflected in this model but has to be considered is the fact that intron
or exon bound splicing factors can remain bound either at the lariat or the mature mRNA, leaving the
spliceosome in this condition.
In contrast, other T-Invariants, for example, the two similar T-invariants i13 (see Fig. 8 for i13)
and i14, contain the ASF/SF2 efflux reaction (
t103.ASF SF2 out
), but not the pertinent influx reaction
(
t140.ASF SF2 in
, see Fig. 9a). Both T-invariants describe the U1 snRNP independent 5'ss recognition,
by interaction of SC35 with SF1/U2AF. A pathway with missing ASF/SF2 influx reaction still makes
sense, considering that it can enter spliceosomal assembly indirect in a condition bound to exonic
sequence near the 5'ss. In agreement with that, the transition
t11.5ss
in
, which allocates the 5'ss exon,
is part of i13 and i14 respectively.