Geology Reference
In-Depth Information
Resolute Bay, Nunavut, in 2006.
Geldsetzer et al.
[2007]
compiled results from the three experiments and pre-
sented plots of angular variation of backscatter coeffi-
cients and a few polarimetric parameters. Figures 8.12
and 8.13, adapted from that study, show parameters
obtained from three surfaces: smooth FY ice with 41 cm
of dry snow cover, MY hummock ice without snow, and
wind‐roughened melt pond water on FY ice. Data from
the wind‐roughened melt pond were acquired during a
gusty wind event (wind was gusting to 12 m/s).
Figure 8.12 shows that the difference between back-
scatter from the co‐polarization channels HH and VV is
sufficiently small that it can be practically neglected. This
is true for FY and MY ice surfaces where each co‐polar-
ized backscatter shows the familiar trend of decrease
with the incidence angle. However, the MY ice has higher
backscatter than FY ice and shows more monotonic
trend of angular decrease. In the case of smooth FY
ice the values stabilize beyond 40° incidence angle.
Backscatter from rough melt pond displays strong angu-
lar dependence, especially in the case of
0
. At low inci-
dence angle (20°) the backscatter takes high values
(reaches zero), then it decreases nonlinearly as the inci-
dence angle increases. The backscatter from the cross‐
polarization is remarkably lower than the co‐polarization
in all cases. It decreases almost monotonically with the
incidence angle in the case of FY ice but shows fluctua-
tions superimposed on the decreasing trend in the case of
MY ice.
that study
] attribute the fluctuations to possible
geometric properties of the complex MY ice surface. The
hh
0
measurements are still higher in the case of MY than
FY ice, evidence of the depolarization caused by the
hv
0
0
Smooth FYI with a snow
Cover of 41 cm
σ
o
hv
σ
o
hh
σ
o
vv
σ
o
hv
σ
o
hh
σ
o
vv
Snow-free MYI hummock
-5
-5
-10
-10
-15
-15
-20
-20
-25
-25
-30
-30
-35
-35
-40
-45
-40
20
30
40
50
60
70
20
30
40
50
60
70
Incidence angle (deg.)
Incidence angle (deg.)
5
σ
o
hv
σ
o
hh
σ
o
vv
Rough melt pond on FYI
0
-5
-10
-15
-20
-25
-30
-35
-40
-45
20
30
40
Incidence angle (deg.)
50
60
70
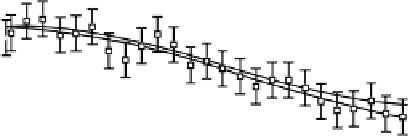
Figure 8.12
Plots of backscatter from the three linear polarization combinations
h
0
,
0
in the C‐band
from FY ice, MY ice, and wind‐roughened melt pond on FYI. Data are compiled from the three field experiments
in the Arctic as mentioned in the text. Fit lines are quadratic equations. Error bars represent standard deviation
[adapted from
Geldsetzer et al.,
2007].
0
, and
hv
vv