Geology Reference
In-Depth Information
is remarkably low. So, it can be assumed, with some reserva-
tions regarding application at high wind speed, that the
water surface does not depolarize the signal, at least
significantly.
A limited number of databases of polarimetric SAR
signatures from ice types have recently been developed.
More data are expected to emerge in the future as research
to develop methods and demonstrate the utilization
of polarimetric data for operational ice monitoring is
growing. It is expected that polarimetric SAR backscatter
will facilitate not only identification of ice types but also
surface conditions. The premise is that different surface
conditions trigger different scattering mechanisms as
explained in section 7.6.2.3. More field studies are needed
in order to verify this point and develop meaningful con-
nections between polarimetric parameters and sea ice
and snow surface conditions.
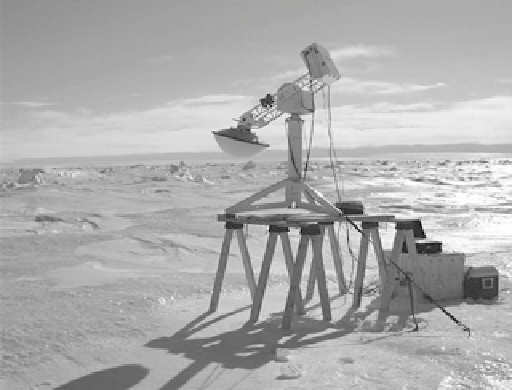
A surface‐based C‐band polarimetric scatterometer
was deployed for the first time by a research team from
the Department of Geography, University of Calgary, to
measure radar backscatter from sea ice in the Arctic in
2004. A photograph of the scatterometer system is shown
in Figure 8.11. It measures calibrated backscatter from
the four polarization modes HH, HV, VH, and VV with a
range resolution 0.30 m. The low noise floor of the scat-
terometer system allowed measurements of cross‐polar-
ized parameters from low scattering mediums. Technical
specifications of the system, its calibration, near‐field
correction, and associated signal processing are described
in
Geldsetzer et al.
[2007]. The system was used in three
field experiments in the Arctic: the Canadian Arctic Shelf
Exchange Study (CASES) in Franklin Bay, Northwest
Territories, in 2004; the NSERC Networks of Centers of
Excellence funded project ArcticNET in Hudson Bay,
Manitoba, in 2005; and the POL‐ICE fieldwork near
8.1.3. Multipolarization Data
As mentioned in section 7.6.2.2, multipolarization
data offer the potential to separate ice types in higher
dimensional space combining co‐ and cross‐polariza-
tion data.
Sandven et al.
[2012] compiled backscatter
data
o
from four ice types (Nilas, FY ice,
MY ice, and ice in marginal ice zone), measured from
Radarsat‐2 data acquired on 23 February 2012
(Figure 8.10). The scatterplot shows the good separa-
bility of Nilas (with it very low backscatter from both
channels due to its very smooth and highly saline sur-
face). Ice in the marginal ice zone is usually rough as
rafting and pancake ice surface are common and the
large number of small ice floes usually have their edges
raised after collision. Raised edges trigger high co‐ and
cross‐polarization signals. The high cross‐polarized
backscatter from MY ice is due to volume scattering
while the same high values for FY ice and the marginal
ice zone are due to rough and deformed surface. What
is surprising in this figure, however, is the overlap
between FY and MY ice signatures in both co‐ and
cross‐polarization data. MY ice is supposed to have a
remarkably higher backscatter in both polarization
combinations than FY ice. Meteorological and surface
conditions of the ice are not described in detail. This
limits the use of the data.
o
and
hh
hv
0
-5
-10
FY ice
-15
-20
-25
-30
-25
-20
-15
σ
0
h
υ
Figure 8.11
Scatterometer system deployed by the Department
of Geography, University of Calgary, in CASES fieldwork in
the Arctic (Franklin Bay, Northwest Territories). The system is
mounted on a platform 2.26 m above the surface, scanning
multiyear sea ice [
Geldsetzer et al.,
2007, Figure 1, with per-
mission from IEEE].
Figure 8.10
Scatterplot of backscatter from Radarsat‐2 HH
and HV polarizations for Nilas, MYI, FYI, and ice in marginal
ice zone obtained on 23 February 2012 [adapted from
Sandven
et al.,
2012].