Geology Reference
In-Depth Information
(a)
(b)
10 mm
100 mm
100 mm
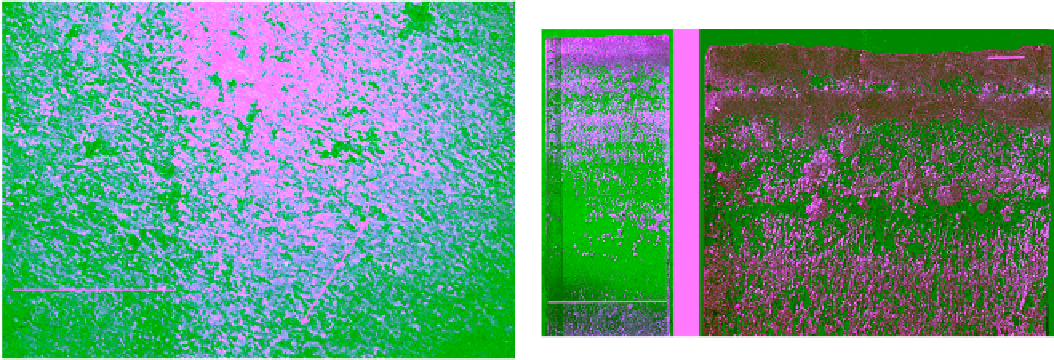
Figure 5.21
Vertical thick section (40 × 100 × 220 mm) of SY
ice in Mould Bay showing (a) concentration and layering of
air inclusions and (b) profile of the top surface and shape of air
bubble in the bulk (photo by N. K. Sinha, unpublished).
Figure 5.20
Top view of SY ice surface, after archaeologi-
cally careful removal of snow, revealing alignment of surface
features including air bubbles in a large area (300 × 200 mm)
with respect to the long axis of Mould Bay; direction of tidal
water current indicated by the arrow (photo by N. K. Sinha,
unpublished).
may explain the row of large bubbles with their surfaces
touching each other. The shape of the voids, however,
changes rather abruptly to long and narrow cylinders. At
depths greater than about 200 mm (as can be seen in
Figure 5.21a) the voids are spherical again, but with
diameters less than 1 mm. These voids were obviously
created when the old ice melted and the meltwater perco-
lated downward through the ice matrix. The relatively
transparent bands of ice and layers of elongated air bub-
bles may “hastily and erroneously” be interpreted as
refrozen layers of meltwater ponds with S1 and/or S2 ice
commonly observed at the surfaces of MY sea ice floes,
as well as in flat areas of shelf ice and glaciers. The elu-
cidation may sound logical but cannot explain the ori-
ented surface features in Figure 5.20. Only forensic type
of microstructural investigations can reveal the true
nature of the ice in this region of importance for micro-
wave backscatter.
Extremely delicate, solid‐state double‐microtoming
technique (to be presented in detail in section 6.2.2) for
preparing thin sections was applied to make large, 100
mm × 200 mm, horizontal sections with thickness in the
range of about 0.5-0.7 mm at various depths. These sec-
tions were prepared from 5 mm thick sections cut from
large blocks of ice extracted from the ice cover using a
chain saw. Actually, several of these large blocks were
used for determining microstructure‐dependent strength
and its strain rate sensitivity for SY ice [
Sinha
, 1985b].
For examinations of the structural changes with depth,
horizontal sections for different depths were prepared
from the same block.
Parallel‐ and cross‐polarized views of a thin section
at a depth of about 3 mm are shown in Figure 5.22.
This thin section corresponds to the midplane of the top
porous and bubbly white layer visible in Figure 5.21b.
It will be seen later that this long dimension is also paral-
lel to the basal planes of the columnar crystals or their
average
c
axis parallel to the water current.
In order to examine the ice surface roughness and the
vertical variation of the voids (or air inclusions), 40 mm
thick rectangular vertical thick sections (100 mm wide
and 200 mm deep) were cut from large ice blocks with a
band saw inside the field laboratory kept at about −15°C,
making certain not to damage the original top surfaces.
The saw‐cut surfaces were then sanded lightly, and after
brushing off the loose ice particles, the grounded surfaces
were wiped lightly with a soft fabric moistened (not
soaked) with chemically pure ethyl alcohol (it is “safer” to
use this inside a closed environment of cold laboratories,
as long as it is not internally consumed at the same time!!).
This cleaning treatment allowed inclusions to be viewed
clearly as shown in Figure 5.21.
The vertical profile of the SY ice in Figure 5.21a
illustrates the general characteristics of entrapped air
bubbles and their variations in shape and size with
depth. The degree of surface roughness and the two
foam‐like white layers near the top can be seen clearly in
Figure 5.21b. These two layers seemed to be created by
the coalescence of spherical bubbles with diameters up
to about 8 mm. Rows of this type of large and isolated
spherical bubbles with irregular surfaces are visible down
to a depth of about 40 mm. The first white layer and the
thin partly clear layer were above the measured free-
board of around 20 mm and above the region of buoy-
ancy forces. The central plane of the second white layer
was parallel to the water line, and the bottom of this
layer was certainly experiencing buoyancy forces. This