Geology Reference
In-Depth Information
80
60
40
20
Ice-snow interface
00
−
20
−
40
16 Dec.96 07:32:47
16 Dec.96 19:22:36
17 Dec.96 07:09:10
17 Dec.96 19:05:44
−
60
−
80
−
100
−
34
−
32
−
30
−
28
−
26
−
24
−
22
−
20
Temperature (°C)
−
18
−
16
−
14
−
12
−
10
−
08
−
06
−
04
−
02
−
00
Figure 3.4
Temperature profiles from the same geographic site as in Figure 3.3 but showing the response of the
profiles to the cooling of the atmospheric temperatures over a short period (nearly 38 h). Air temperature dropped
from −24.4 to −32.3 °C within 36 h between 16 and 17 December, 1996. Note that the top of the snow layers
is more affected by variations in air temperature while ice temperature profiles remained fixed (M. Shokr,
unpublished).
0
-
10
-
20
-
30
-
40
50
-
2.0
/
0
-
4.0
/
-
2
.
0
-
6.0
/
-
4
.
0
-
8.0
/
-
6
.
0
-
10.
/
-
8
.
0
-
12.
/
-
10.
-
14.
/
-
12.
-
16.
/
-
14.
-
18.
/
-
16.
-
20.
/
-
15.
0
-
50
-
100
-
150
-
200
-
250
Sep 27
Nov 26
Jan 25
Mar 26
May 25
Jul 26
Sep 22
Nov 21
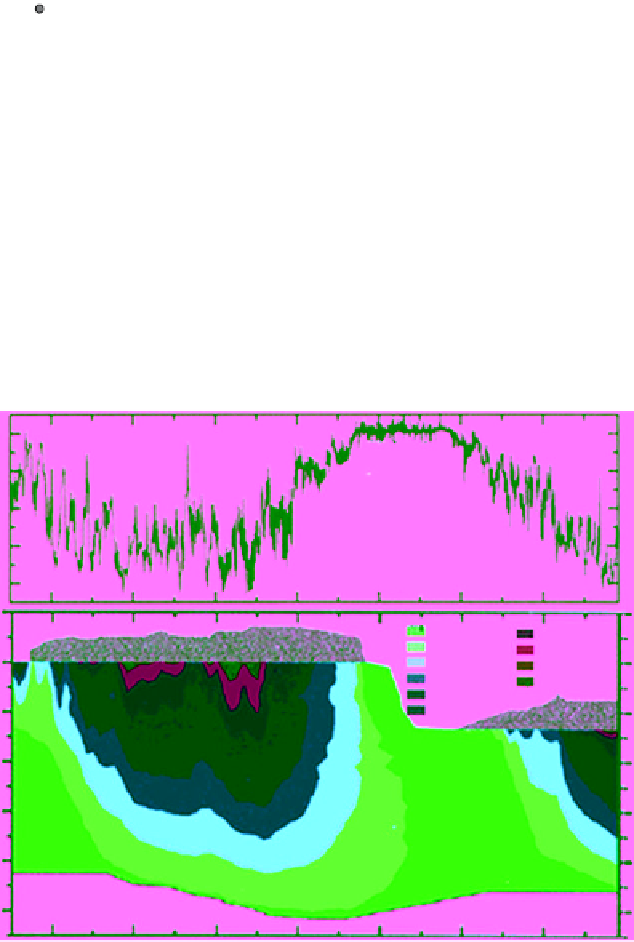
Figure 3.5
(
Top
) Evolution of air and (
Bottom
) ice temperature distribution in a multiyear floe in Beaufort Sea from
27 September, 1993 to 21 November, 1994. The gray shaded area denotes snow cover. Bottom contour denotes
the ice‐ocean interface. Each color in the color code represents a step of 2° (adapted from
Perovich et al.
[1997],
Figure 1, with permission from AGU). (For color detail, please see color plate section).