Biomedical Engineering Reference
In-Depth Information
(a)
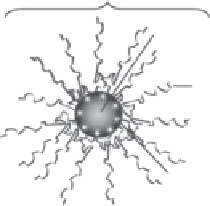
SERS label
AuNP
PEG
shell
Raman
reporter
(b)
(c)
ħω
L
1E-18
ħω
L
9×10
-20
9×10
-20
1E-19
6×10
-20
6×10
-20
3×10
-20
1E-20
0
3×10
-20
1.5
2.0
2.5
1E-21
ħω
ge
(eV)
0
1.50
3.00
ħω
ge
(eV)
4.50
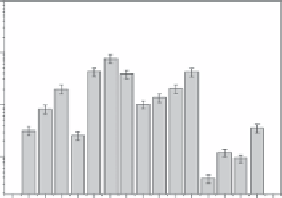
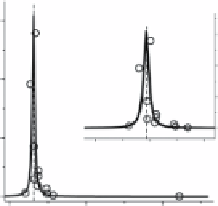
figure 11.7
(a) Sketch of the structure of SERS labels. (b)
dσ
R
/
dΩ
for the most intense
bands of 12 SERS labels at excitation wavelength of 632.8 nm. The wavenumber
corresponding to the Raman band is reported above each bar. (c) Values of
dσ
R
/
dΩ
with the
optical excitation energy
hω
ge
of the 12 SERS labels are well fitted by a Lorentzian curve
(black line) centered at the laser excitation energy
hω
L
of 1.96 eV (632.8 nm). inset shows a
magnification of the region around the Lorentzian maximum. (Reprinted with permission
from Ref. [63]. © Wiley.)
of SERS probes, and nanoparticles in general, remain poorly understood. This is
a critical challenge that needs to be addressed for effective translation of SERS
probes into clinical settings.
11.5.2
combination with other techniques for Bioimaging
Raman imaging allows for highly sensitive and specific detection of SERS contrast
agents, as well as the detection of multiple agents in living subjects, thanks to its
unique signature of SERS spectra [19, 70-73]. it can combine Raman imaging with
other imaging techniques, such as magnetic resonance imaging (MRi) and photo-
acoustic imaging, serving as a multiple-modality strategy. a recent work combined
MRi, -photoacoustic and Raman imaging as a new triple-modality strategy to noninva-
sively image brain tumor margins, which enables more accurate brain tumor imaging
and resection (see fig. 11.9) [20]. The tumor visualization at a depth of 2-5 mm was
achieved through the intact skin and skulls of live mice, although Raman imaging has
limited penetration depth.
Search WWH ::

Custom Search