Biomedical Engineering Reference
In-Depth Information
Core
(a)
Satellites
(b)
Satellites
Core
Core-satellite
50 nm
50 nm
(c)
(d)
(e)
(f)
20 nm
20 nm
20 nm
20 nm
(b)
9000
8000
7000
Intensity
15
Intensity
9957
1000
100
10
1
0.1
Core-satellite
chain
6000
10
5000
4000
1
3000
Core-satellites
2000
0.1
1000
Core
Core-satellites
Core
0
600
800
1000 1200
Raman shift (cm
-1
)
1400 1600 1800
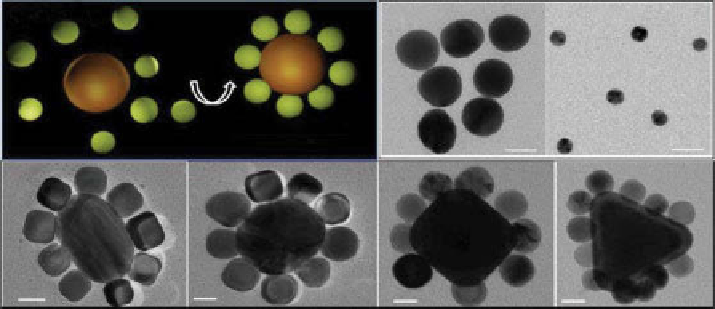
figure 11.5
Structure of plasmonic planet-satellite analogs and chain structure using shape-
controlled nanostructures as building blocks. upper panel: (a) illustration of the core and satellites
assembling in solution phase to form organized core-satellite clusters. (b) TEM images showing as
synthesized gold nanoparticles with (left) 65 nm diameter, employed as cores, and 35 nm diameter,
employed as satellites. Middle panel: representative TEM images showing the core-satellite struc-
tures observed upon successful assembly of shape-controlled nanostructures. (c) Truncated nano-
cubes around nanosphere. (d) Truncated nanocubes around truncated nanocube. (e) nanospheres
around sharp nanocube. (f) nanospheres around nanoprism. TEM images showing further assem-
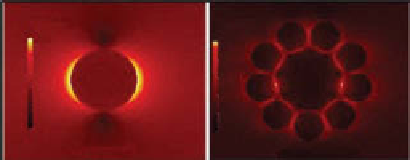
bly of core-satellite clusters into chains. Lower panel: (a) electric field distribution around the
cores, core-satellites, and core-satellite chain obtained using fDTD simulations. The core-satellite
cluster and the chain exhibit large enhancement (∼700 times) in electric field intensity compared to
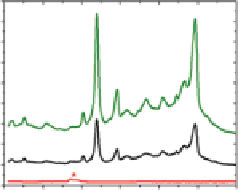
the cores. (b) Surface-enhanced Raman scattering spectra of the cores, core-satellite clusters, and
their chains. While the Raman bands from cores were not distinguishable, clusters, and chains
exhibited strong Raman bands corresponding to the molecular cross-linker used for self-assembly.
(Reprinted with permission from Ref. [16]. © Wiley.)
EM hot spot within the nanostructures (formed between the core and shell) as
opposed to previous approaches involving the assembly of two or more nanoparti-
cles. The SERS Ef achieved in this design is approximately 5.0 × 10
9
. These SERS
probes exhibited strong Raman signals for 633 nm excitation and virtually no signal
for niR (785 nm) excitation, which makes them nonideal for
in vivo
bioimaging
applications. More recently, we reported an ultrabright SERS probe comprised of
Raman reporters trapped in a subnanometer gap between gold core and shell (see
fig. 11.6) [61]. These Bilayered Raman-intense gold nanostructures with Hidden
Search WWH ::

Custom Search