Biomedical Engineering Reference
In-Depth Information
6.7.3.3 Fluorescence Correlation Spectroscopy
fluorescence correlation spec-
troscopy (fCS) is a sensitive technique that utilizes statistical analysis of the
fluctuations in fluorescence to assess diffusion or fluctuations of the molecules [91].
Initially introduced to measure the binding of dyes to DNa, the technique has been
expanded to characterize the photochemistry of dyes, to monitor conformational per-
turbations of fluorescent proteins and DNa, and, more recently, to characterize the
size and translational mobility of fluorescent nanoparticles [92-94].
The primary parameter measured in fCS is fluorescence intensity. The changes
in fluorescence intensity over a relatively short period of time reflect the
concentration fluctuations of a molecular system. The changes are recorded in
the form of an autocorrelation function,
G
(
t
) (fig. 6.24), using a confocal micro-
scope equipped with a correlation card that calculates the autocorrelation function
from the intensity signal. In fCS, the autocorrelation function is the cross-correlation
of a fluorescence intensity signal with itself and is obtained by comparing a mea-
sured value at a time with florescence intensity at a later time (delayed by
τ
). The
autocorrelation function reveals the time required for a particle to diffuse through
an open confocal volume size of less than 1 fl (femtoliter). Two signals that
are recorded at nearly the same time (
τ
is small, i.e., microseconds) are expected
to have a high correlation value. Those signals recorded far apart (
τ
is large, i.e.,
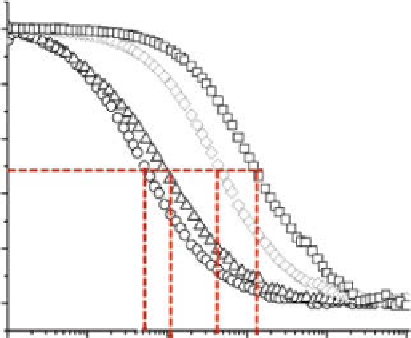
milliseconds) result in a lower correlation value. With everything equal, larger
particles are expected to have higher correlation than smaller particles leading to the
corresponding shift (to the right) in the autocorrelation function such as shown in
figure 6.24.
fCS curve fitting provides the correlation time and nanoparticle number. Data anal-
ysis is straightforward but often is complicated by the polydispersity of nanoparticles,
1.0
0.8
11 nm QDs
40 nm gold colloids
110 nm latex beads
290 nm uorescent beads
0.6
0.4
0.2
0.0
1E-5
1E-4
1E-3
0.01
0.1
1
τ
(s)
figure 6.24
autocorrelation functions for particles ranging in diameter from 11 nm
quantum dots, 40 nm gold colloids, 110 nm nonfluorescent latex beads, and 290 nm fluorescent
beads. (Reprinted with permission from Ref. [95]. © american Chemical Society.)

Search WWH ::

Custom Search