Biomedical Engineering Reference
In-Depth Information
T
1
relaxation
100
75
50
T
1
= 1500 ms
T
1
= 1000 ms
Contrast (5×)
25
0
0
1000
2000
Time (ms)
3000
4000
5000
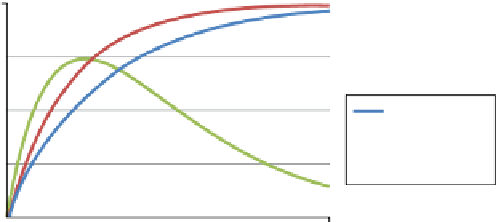
figure 6.15
MRI signal intensity (arbitrary units) for tissues with
T
1
values of 1500 ms or
1000 ms over a range of TR values. The tissue with the shorter
T
1
relaxes back to equilibrium
faster than the tissue with the longer
T
1
. Subtracting the MRI signals provides the image con-
trast between the two tissues (expanded fivefold to aid visualization). The maximum image
contrast occurs with a TR of 1200 ms.
To measure the
T
1
relaxation time of a tissue, images are collected with different
TR values. The MRI signal is plotted versus the TR, and the data is fit to the longitudinal
relaxation equation. as shown in figure 6.15, a tissue with a
T
1
of 1000 ms relaxes
back to equilibrium faster than a tissue with a
T
1
of 1500 ms. Subtracting the signal
with a
T
1
of 1000 ms from the signal with a
T
1
of 1500 ms yields the image contrast
(fig. 6.15, expanded by fivefold to aid visualization). The maximum contrast between
these tissues would be obtained with an image using a TR of 1200 ms.
T
2
-weighted images have been developed to highlight differences in the
T
2
relax-
ation of different tissues.
T
2
-weighted images are created when both the TR and TE
are long. The long TR allows all the spins to relax back to equilibrium before the next
imaging cycle, minimizing
T
1
relaxation effects. However, the long TE allows dis-
tinction to be made between tissues with different
T
2
times. Tissues with a short
T
2
will lose a great deal of signal during TE and will appear dark. However, tissues with
a long
T
2
will not relax as much during TE and will appear bright.
To measure
T
2
relaxation times, images are collected with different TE values.
The MRI signal is plotted against the TE, and the data is fit to the transverse relaxa-
tion equation. figure 6.16 shows that the tissue signal will decay more rapidly with
a
T
2
of 100 ms compared to 150 ms. Subtracting these two signals demonstrates that
the image contrast (fig. 6.16, expanded by fivefold to aid visualization) is maxi-
mized in an image with a TE of 120 ms.
Images collected with a long TR and a short TE will produce a proton density-
weighted image. The long TR allows all the spins to return to their relaxed state
before the start of the next sequence. In addition, the short TE minimizes the effects
of
T
2
relaxation. Proton density images tend to display poor tissue contrast because
most parts of the body have essentially the same concentration of protons.
as with many medical imaging modalities, intravenous contrast agents are often
used in MRI to enhance the signal of certain tissues in the body. MRI contrast agents


Search WWH ::

Custom Search