Biomedical Engineering Reference
In-Depth Information
particles is dependent upon their size, by monitoring the fluctuations in light intensity
on microsecond timescales, size information can be obtained. The intensity data is
fit to a model that calculates the translational diffusion coefficient, which using
the Stokes-Einstein equation can be used to estimate the hydrodynamic radius of
a particle. as Stokes-Einstein assumes a spherical particle, DlS is not a useful
technique for obtaining sizing information of particles with large aspect ratios.
Monitoring the light scattering of a particle suspension provides information about
large numbers of particles, giving both a particle size distribution and a statistically
valid average size.
Sample preparation for DlS measurements involves creating a stable particle
suspension. Water, organic solvents, and biologically relevant fluids such as saline
and buffer solutions can all be used to suspend particles. Sonication, vortex mixing,
and dilution can all be used to help create a stable particle suspension. DlS works
equally well for inorganic and organic particles; however, samples that flocculate and
settle out of solution, fluoresce, or are extremely polydisperse create artifacts that can
lead to poor data quality. Polydisperse samples can be filtered or centrifuged to
remove large aggregates or contaminants. for analysis of fluorescent particles,
optical filters can be installed on a DlS system to eliminate the detection of emis-
sions from the particles, or an alternate wavelength laser can be used for illuminating
the sample.
While DlS is very easy to use, due to the large amount of mathematical processing
that is conducted by the system, the results are often not well understood by users and
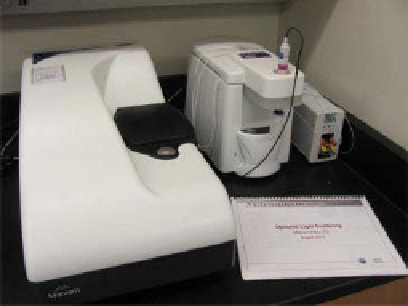
can be easily misinterpreted. Many modern DlS systems (such as shown in fig. 6.11)
may provide at least four different interpretations of the same sizing data including
intensity-based particle size distribution (fig. 6.12), volume-based particle size dis-
tribution, number-based particle size distribution, and a “z-average.” It is entirely
possible for all four interpretations to be valid yet provide different results for a
single sample; therefore, those utilizing the technique should be familiar with the
assumptions used and applications of the different forms of data interpretation.
figure 6.11
Zetasizer Nano ZS dynamic light scattering system from Malvern Instruments.
Search WWH ::

Custom Search