Biomedical Engineering Reference
In-Depth Information
(a)
(b)
(c)
(d)
(e)
1 µm
100 nm
200 nm
20 nm
100 nm
(f)
(g)
(h)
(i)
100 nm
1 µm
500 nm
100 nm
[111]
(j)
(k)
(l)
(o)
(m)
(n)
500 nm
500 nm
500 nm
100 nm
100 nm
50 nm
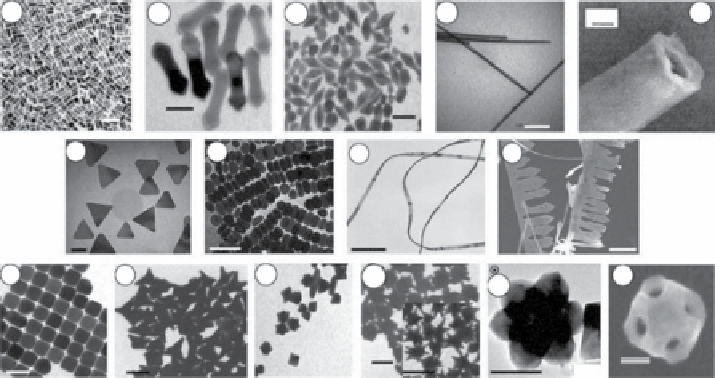
figure 5.10
Representative examples of nonspherical 1D, 2D, and 3D nanoparticles
(NPs) synthesized by the colloid-chemical synthetic approach. The first row shows the Tem
(a-d) or sem (e) images of NPs, where major growth has taken place in 1D: (a) nanorods,
(b) nanoshuttles, (c) nanobipyramids of Au/Ag, (d) silver nanowires, and (e) Au nanotubule.
The middle row shows some examples of 2D NPs: Tem images of (f) triangular Au nanoplate,
(g) silver nanodisk, and (h) Au ribbons; (i) sem image of Au belts. The bottom row shows
Tem or sem images of some typical 3D (such as polyhedral, branched, and hollow/porous)
NPs: (j) nanocubes, (k) tetrapods, and (l, m) star-shaped Au particles; (n) Ag nanohexapods
and (o) Au-Ag nanocage. (Reproduced with permission from Ref. [98]. © Wiley-VcH Verlag
gmbH & co. KgaA.)
for example, in the monitoring of antitumor necrosis factor (anti-TNf)
ex vivo
,
gold nanorods with a concentration down to 1 pm in phantoms and 10 pm in
biological tissues have been imaged with good signal-to-noise ratio and high spatial
resolution [109].
In OA imaging techniques, the signal from a PA effect is proportional to optical
absorption [110]. Thus, high optical absorption of the contrast agent is a very critical
requirement for OA imaging. Hu
et al
. compared absorption and scattering spectra
calculated for a variety of nanoparticles [103]. The presented review data revealed
that gold nanocages and nanorods have much larger absorption and scattering cross
sections than gold nanoshells: that is,
C
rod
≈
C
cage
>
C
shell
(fig. 5.11 upper part), making
gold nanocages and nanorods better candidates for OA imaging and PT therapy. It is
also well known that by changing the shape of nanoparticles to that of elongated
rods, the optical characteristics of the gold nanoparticles can be significantly changed
leading to the absorption at longer wavelengths [111]. The calculated absorption and
scattering of the surface plasmon band of gold nanorods is shown in figure 5.11
(middle and bottom parts, respectively). The spectra demonstrate that the plasmon
maximum of the nanorods (corresponding to the mode with the electric field parallel
to the long axis of the nanorod) lies in the desirable NIR region, thus making gold
nanorods potentially useful for
in vivo
applications.
Search WWH ::

Custom Search