Biomedical Engineering Reference
In-Depth Information
The first demonstration of cNTs as OA contrast agents was performed by Zharov
et al
. in 2007 [79] through
in vitro
and
in vivo
detection of circulating
Staphylococcus
aureus
and
Escherichia coli
labeled with cNTs. The detection was performed in
blood flow using
in vivo
PA and PT flow cytometry (PAfc/PTfc) system [86]. In
2008, de la Zerda
et al
. [87] demonstrated the first
in vivo
PA imaging of cNTs by
molecularly targeting sWNTs to tumor neovasculature using arginine-glycine-
aspartic acid (RgD) peptide in living mice. since then, multiple groups have pro-
posed various chemical modifications to cNTs that enhance their PA signals, as well
as demonstrating new applications of the PA technique using cNTs. chemical mod-
ifications included coating of cNTs with organic optical dyes [88], gold with folates,
antibodies for molecular targeting of circulating tumor cells (cTcs), and primary
tumors [89] as well as endothelial lymphatic LYVe-1 receptors [83, 90]. cNTs were
also suggested as potential contrast agents for sLN imaging [87, 91].
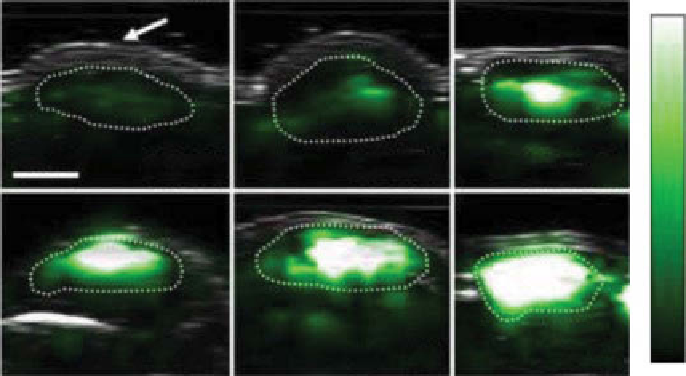
sWNTs conjugated with cyclic RgD peptides were used as a contrast agent for
OA imaging of tumors in living mice [87]. In this study, mice were injected subcuta-
neously with sWNTs at increasing concentrations from 50 to 600 nm (fig. 5.7. The
sensitivity in living mice was found to be 50 nm (i.e., 50 nm of sWNT-RgD gave the
equivalent PA signal as the background tissue signal).
mice bearing u87 glioblastoma xenograft tumors injected with sWNT-RgD
showed significantly higher PA signal in the tumor as compared with untargeted
sWNTs (fig. 5.8. The high OA signal in the mouse injected with plain sWNTs (indi-
cated by the white arrow) is not seen in the subtraction image, suggesting that it is
due to a large blood vessel and not sWNTs. However, the minimum detectable
100
Skin
3 mm
50 nM
100 nM
200 nM
300 nM
400 nM
600 nM
0
figure 5.7
Optoacoustic detection of single-wall carbon nanotubes (sWNTs) in living
mice. mice were injected subcutaneously with single-wall carbon nanotubes at concentrations
of 50-600 nm. The dotted lines on the images illustrate the edges of each inclusion. A gray
scale ultrasound B-mode image showing the skin level was overlaid with the OA image
(
white
). (Reproduced with permission from Ref. [87]. © Nature Publishing group.)
Search WWH ::

Custom Search