Biomedical Engineering Reference
In-Depth Information
1100
1000
900
800
700
600
500
Sudden decrease of the peak intensities of
the S sample in the ngerprint region
400
300
200
100
0
Pink
: A2780S-Control
Red
: A2789SCis-0.3umCDDP
Blue
: A2789SCis-1umCDDP
Green
: A2789SCis-3umCDDP
1600
1400
1200
1000
800
Raman Shift (cm
-1
)
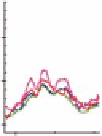
Figure 6.12
Treated S spectra, fingerprint region.
Pink
: A2780S-Control
Red
: A2789SCis-0.3umCDDP
Blue
: A2789SCis-1umCDDP
Green
: A2789SCis-3umCDDP
200
100
0
3000
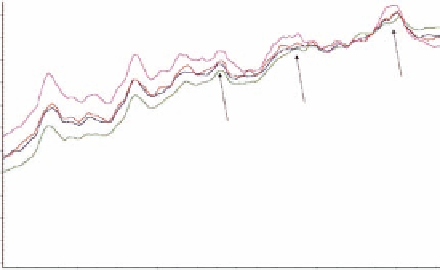
Sudden change in the
peak intensities of the S
samples in the CH region
Figure 6.13
Treated S spectra, CH region.
4400
4200
4000
3800
3600
3400
3200
3000
2800
2600
2400
2200
2000
1800
1600
1400
1200
1000
800
600
400
200
Red
Blue
: GCT27 (R)
: GCT27 (S)
3000
2500
2000
1500
1000
500
Raman Shift (cm
-1
)
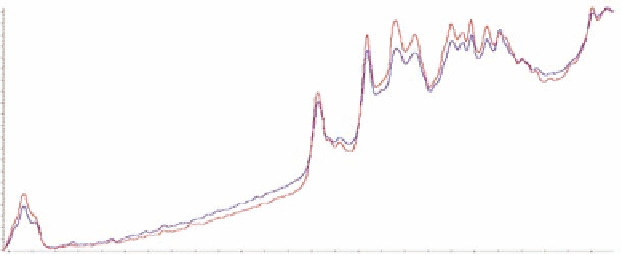
Figure 6.14
Comparative image of GCT27 spectra.


Search WWH ::

Custom Search