Biomedical Engineering Reference
In-Depth Information
0.16
2880
0.14
1096
992
1442
1260
2930
2851
0.12
0.10
1662
0.08
0.06
0.04
0.02
0.00
-0.02
3000
2500
Wavenumber/cm
-
1500
2000
1000
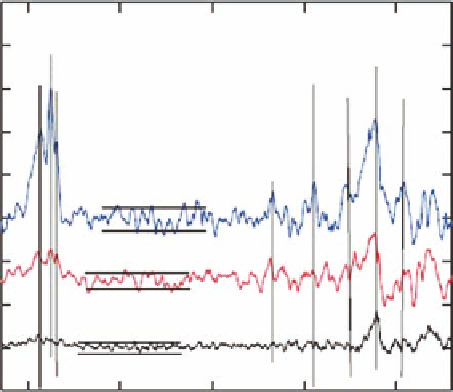
Figure 5.5
Raman difference spectra among various grades of IDC and control tissues. Grade I minus
control, Grade II minus control, and Grade III minus control are in black, red, and blue, respec-
tively. Horizontal double lines indicate the level of noise in order to facilitate justification of
peak significance.
0.25
2880
2851
0.20
1442
0.15
1662
780
1260
1955
992
0.10
0.05
0.00
3000
2500
2000
Wavenumber/cm
-1
1500
1000
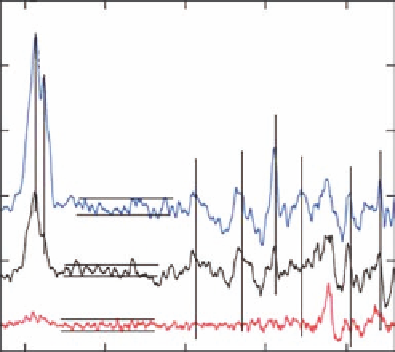
Figure 5.7
Raman difference spectra among various grades of DCIS and control tissues. LNG grade
minus control, ING grade minus control, and HNG grade minus control are in red, black and
blue, respectively. Horizontal double lines indicate the level of noise in order to facilitate justi-
fication of peak significance.
Search WWH ::

Custom Search