Biomedical Engineering Reference
In-Depth Information
ABC
D
E
F
G
H
I
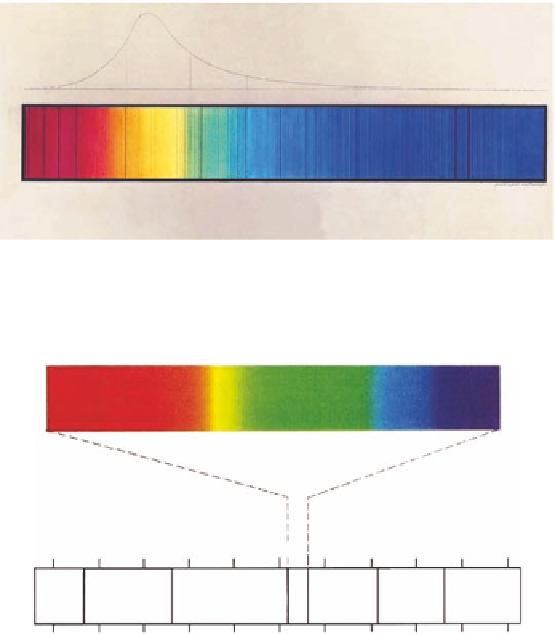
Figure 1.1
Solar spectrum drawn and coloured by Fraunhofer with the dark lines named after him, 1817.
(Courtesy Deutsches Museum, Munich, Germany. With permission.)(1-3).
Visible light
Low energy
High energy
Frequency (s
-1
)
3 × 10
10
3 × 10
12
3 × 10
14
3 × 10
16
3 × 10
18
Radio
waves
Gamma
rays
Microwaves
Infrared
Ultraviolet
-rays
10
-1
10
-2
10
-3
10
-4
10
-5
10
-6
10
-7
10
-8
10
-9
10
-10
10
-11
Wavelength (m)
Figure 1.3
Electromagnetic spectrum.
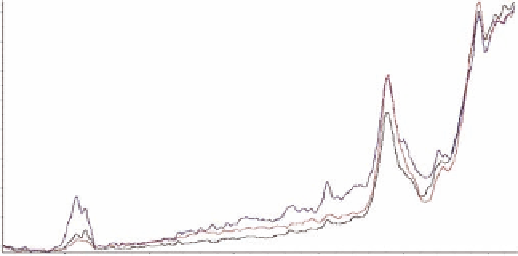
0.9
Red
: Normal breast tissue
Black
: IDC Grade III
Blue
: DCIS-HNG
0.8
0.7
0.6
0.5
0.4
0.3
0.2
0.1
3000
2500
2000
Raman Shift (cm
-1
)
1500
1000
500
Figure 5.1
Raman spectra of normal, DCIS (HNG), and IDC (GIII) breast tissues.
Search WWH ::

Custom Search