Biomedical Engineering Reference
In-Depth Information
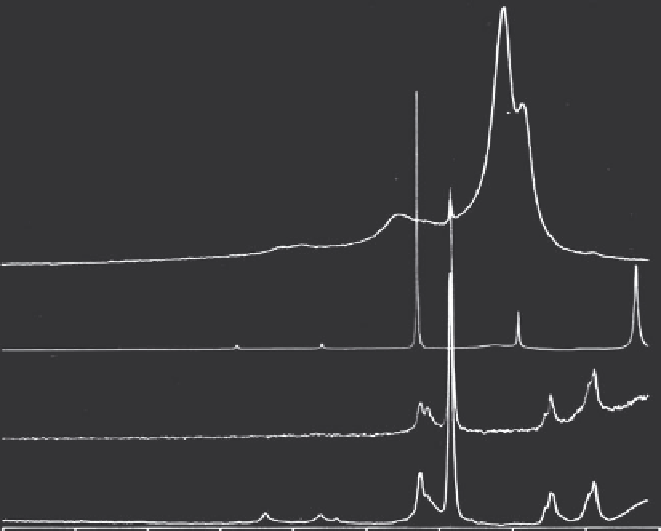
Synthetic Hydroxyapatite (c)
Calcium Carbonate
Carbonated Apatite
Deproteinated Human Bone
2620
2350
2080
1810
1540
Wavenumber
1270
1000
730
460
1
Figure 7.5
Raman spectra of commercial synthetic hydroxyapatite (A), calcium phosphate (B), calcium
carbonate (C), calcium hydroxide (D), and sodium hydroxide (E). (With permission.)
content, using 0.6-g samples, as a result of this procedure. Walters et al. [12]
proposed that when larger samples are used, as was done in this study, the
decrease in the protein content of the sample surface is still equal to about
85%. Figure 7.2 shows a considerable reduction in the scattering intensities of
peaks that arose from the organic phase of the tissue indicating the deprot-
eination of human and sheep bones. The peaks at 1660, 1262, and 1242 cm
−1
were likely due to the amide bands of collagen (a combination of C=O stretch-
ing, C-N stretching, and N-H bending modes), which disappeared (with an
80-90% decrease, as very small peaks were still present) upon deproteination.
This percentage decrease was calculated by measuring the peak areas of the
C-H peaks (organic phase) present in the region of 3000-2800 cm−l
−l
and taking
a ratio with the unchanged peak of symmetric phosphate peak centred at
952 cm
−1
. Walters et a1. [12] concluded that the chemical and morphologic
changes in the bone mineral as a result of hydrazine treatment are minimal.
The present results support this view, as there were no significant changes in
the wavenumber and scattering intensity upon deproteination, whereas the
associated changes in the organic peaks were noticeable (Figures 7.1 and 7.2).
Search WWH ::

Custom Search