Geoscience Reference
In-Depth Information
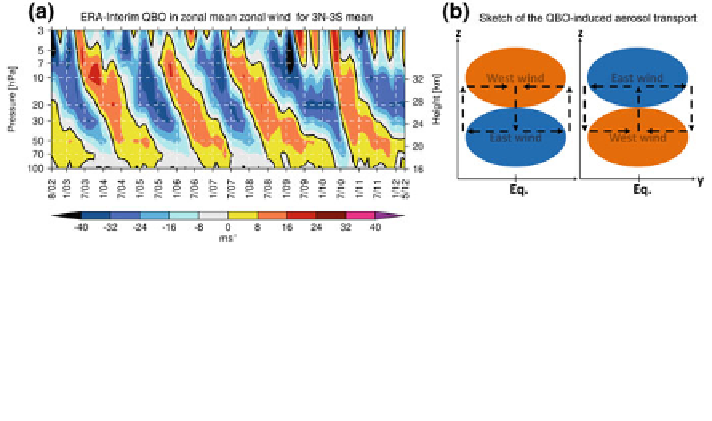
signature found in the SCIAMACHY aerosol extinction coef
cients around 30 km
altitude is consistent with the known QBO periods (22
34 months). Following this
idea, Fig.
3
a shows an altitude-time cross section of the ERA-Interim equatorial
zonal-mean zonal wind averaged between 3
-
S. About every two years, the
zonal-mean zonal wind changes its direction from eastwards (westerly winds) to
westwards (easterly winds) and from westwards to eastwards, respectively. The
wind transition line is also called the shear line, as the strongest vertical wind shear
generally occurs at the time of the wind transition (Baldwin et al.
2001
). In the
following, the time period when a wind transition occurs at pressure levels between
7 and 50 hPa (21
°
N and 3
°
35 km) is referred to as wind shear period. Furthermore, we
-
de
ne the wind phase by the zonal wind at 50 hPa, i.e., the period of westerly winds
at 50 hPa is referred to as westerly phase and the period of easterly winds at 50 hPa
is referred to as easterly phase.
The QBO in the equatorial zonal wind, however, does not directly imply any
vertical transport of aerosols, which is necessary to obtain the distributions shown
in Figs.
1
and
2
. The potential key to this problem lies in the secondary meridional
circulation (SMC) that is associated with the QBO (e.g., Baldwin et al.
2001
; Choi
et al.
2002
). The sketch in Fig.
3
b describes (in line with Baldwin et al. (
2001
) and
references therein) the basic features of the SMC related tracer transport. Sche-
matically it shows two simpli
ed situations of Fig.
3
a in an altitude(z)-latitude(y)
diagram. For instance, the conditions observed in October 2003 at pressure levels
around 20 hPa are described in the left panel of Fig.
3
b. In the lower altitude layers
we
find an easterly zonal wind and a westerly zonal wind at higher altitudes. This
situation re
ects a so-called westerly wind shear of the QBO. In October 2004, for
instance, we have the opposite wind situation shown in the right panel of Fig.
3
b,
which is referred to as an easterly wind shear.
fl
Fig. 3 a Time series of the ERA-Interim zonal-mean zonal wind averaged between 3
°
N and 3
°
S
from August 2002 to April 2012 representing the quasi-biennial oscillation of the equatorial
stratosphere. The reddish colours indicate westerly zonal wind (positive wind speeds) and the
bluish colours easterly zonal wind (negative wind speeds). The black contour line is the wind
transition. b Scheme of special wind periods of the QBO and effects on the aerosol transport in the
stratosphere marked by the black dashed arrows. The westerly shear involves an equatorial
downwelling (left) and the easterly shear an equatorial upwelling (right), both relative to the mean
upwelling associated with the residual mean meridional circulation in the stratospheric
Search WWH ::

Custom Search