Information Technology Reference
In-Depth Information
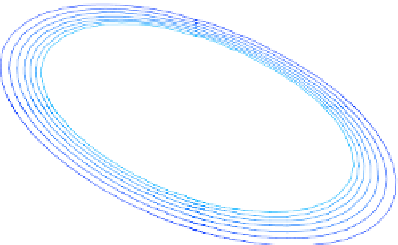
Fig. 14.3
Variance gamma
density in
d
=
2and
corresponding contour plot
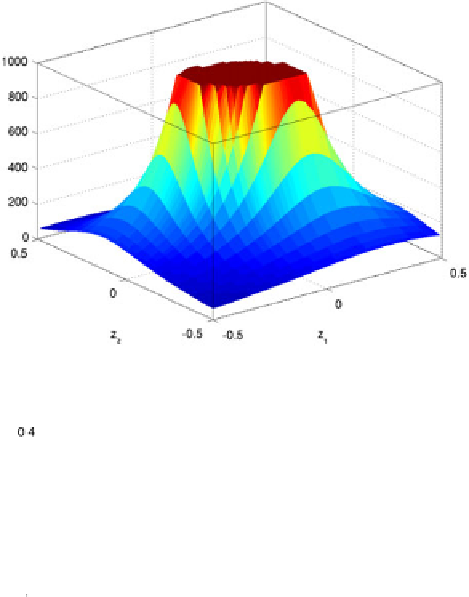
Note that this is again an anisotropic
α
-stable process. We plot the density (
14.14
)
for
d
=
2,
ϑ
=
0
.
5,
η
=
0
.
5 and
α
=
(
0
.
5
,
1
.
2
)
in Fig.
14.4
.
14.3.3 Admissible Models
We make the following assumptions on our models.
Assumption 14.3.4
Let
X
be a
d
-dimensional Lévy process with characteristic
triplet
(
Q
,ν,γ)
, Lévy density
k
and marginal Lévy densities
k
i
,
i
=
1
,...,d
.
(i) There are constants
β
i
>
0,
β
i
>
1,
i
=
1
,...,d
and
C>
0 such that
C
e
−
β
i
|
z
|
,z<
−
1
,
k
i
(z)
≤
(14.15)
e
−
β
i
z
,
z>
1
.


Search WWH ::

Custom Search