Biomedical Engineering Reference
In-Depth Information
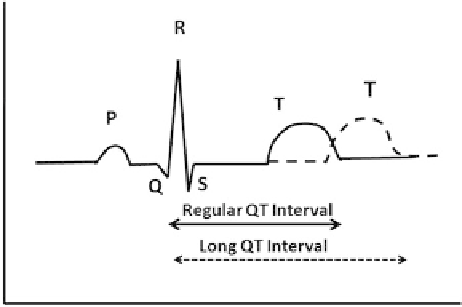
Fig. 3 A schematic diagram of electrocardiogram (ECG), recorded at the body surface, represents
series of waves generated by electrical events of different chambers and conduction pathways
within the heart. A typical ECG tracing of a normal heart beat consists of P wave, QRS complex
and T wave [
44
]. P wave is the electrical signature of current that causes atrial contraction. Both
the left and right atria contract simultaneously. The change in shape of P wave may indicate atrial
problems. The QRS complex corresponds to the current that causes contraction of the left and right
ventricles, which is much more forceful than that of the atria and involves more muscle, thus
resulting in a greater ECG deflection. The Q wave represents the small horizontal current as action
potential travels through interventricular septum. The R and S waves indicate contraction of the
myocardium. The T wave represents the repolarization of the ventricles. The ST segment connects
QRS complex and T wave. This segment lasts about 0.08 s and is usually level with the PR
segment. The QT interval (time from the beginning of the QRS complex to the end of T wave) of
the ECG is a measure of the duration of ventricular depolarization and repolarization [
146
].
Ventricular repolarization, determined by duration of cardiac action potential, is a complex
physiological process. It is the net result of activities of many membrane ion channels and
transporters. Under physiological conditions, the functions of these ion channels and transporters
are highly interdependent. The activity of each ion channel or transporter is affected by multiple
factors including, but not limited to, intracellular and extracellular ion concentrations, membrane
potential, cell-to-cell electrical coupling, heart rate and autonomic nervous system activity.
The rapidly and slowly activating components of I
Kr
and I
Ks
seem to have the most influential
role in determining the duration of the action potential and the QT interval [
147
-
150
]
rate among animals occurs which is either difference in autonomic tone or effects of
test substances on heart rate ideally. QT interval data obtained after administration
of a test substance should be compared with control and baseline data at similar
heart rates. When the heart rate variability is not due to the test substance, it can be
reduced by acclimatization, or by use of anesthetized animal models [
45
].
2.2 Drug-Induced QT Prolongation
Drug-induced QT prolongation and the accompanying proarrhythmic risk are
major regulatory concerns in drug development [
44
]. Drugs that delay ventricular
repolarization and prolong. QT interval are associated with an increased risk of