Information Technology Reference
In-Depth Information
Like interferes with like
Some experiments used the same shape attribute to convey more than one
variable. A “Chappe Telegraph” visualization used two angles to convey
two quantitative data attributes from stock data (Fig. 3.24); and a
visualization of survey data used categorical curves to form an oval (Fig.
3.25).
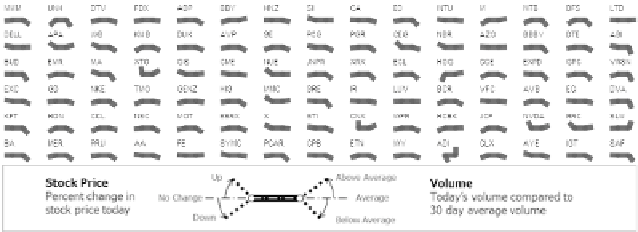
Fig. 3.24.
Use of two quantitative angles to convey two data attributes.
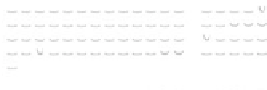
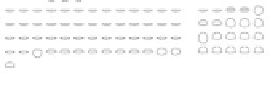
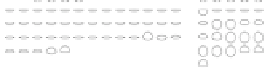
Fig. 3.25.
Each glyph indicates a consumer purchase of gasoline. Left side has a
single curve per glyph indicating one data variable. Right side shows two curves
per glyph indicating two data variables.
When combining multiple data points together using the same type of
shape attribute above, it seemed easy to perceive the existence of outliers,
e.g. a shape with large angles in Fig. 3.21, or sharp curves in Fig. 3.22, but


Search WWH ::

Custom Search