Information Technology Reference
In-Depth Information
it was not easy to perceive each data point separately, e.g. focus on left
hand angles only or focus on top curves only.
Therefore, subsequent visualization experiments applied different data
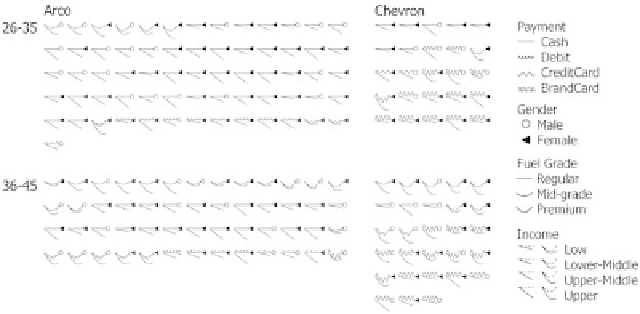
variables onto different shape attributes. For example, a variant of the gas
survey dataset shows four different data variables applied to four different
shape variables: curvature, edge type, terminator, and angle (Fig. 3.26).
Similarly, in a “World Demographics” visualization three different data
variables correspond to three different shape attributes: curvature, angle,
and terminator (Fig. 3.27).
Fig. 3.26
.
Trumpet glyphs: Each glyph represents one consumer purchase of
gasoline indicating four different data variables using different shape attributes:
curvature, line style, serifs, and angle.
It appeared easier to perceive and understand mappings when different
variables were mapped to different shape attributes. This should follow
from the general rule “like interferes with like” [War08] or “use different
visual dimensions differently” [Bra97]. Therefore using different shape
attributes can help increase distinctness and potentially aid visual scanning
by enabling focus on the particular salient shape attribute while masking
out other shape attributes within the visualization.
However, this general rule must be applied with care. For example,
scientific tensor visualization (Fig. 3.7) used curvature to convey more
than one dimension for decades and presumably is effective. Similarly, the
experiment “Stock Correlation Visualization” below (Fig. 3.28) depicts
five triplets of variables as arms of a star, with twist being used
consistently to represent one variable, bulge being used to represent the
second variable, and amplitude representing the third variable.
Search WWH ::

Custom Search