Information Technology Reference
In-Depth Information
•
Superquadrics
[Bar81], and similar variants of curvature-based
parametric shapes, have been used in numerous expressive
scientific visualizations.
•
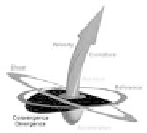
Tensors
: A wide variety of compound glyphs are used in
scientific visualization, e.g. [Pos95]. Some glyphs use attributes
such as curvature and twist to indicate data attributes.
•
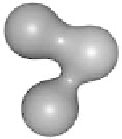
Blobs
(implicit surfaces based on volume rendering of density
fields) generate smooth, closed, curved shapes. Different parts of
the object correspond to different data attributes.
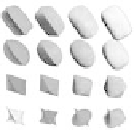
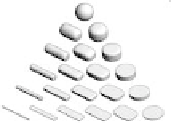
Fig. 3.7
. From left to right, superquadrics [Bar81]; curvature in two dimensions,
height & depth [Kin06]; compound glyph of a tensor [Pos95]; sample blob.
Novel information visualization
Whereas scientific visualization is often based on representing physical
real-world phenomena and is therefore constrained to fitting representations
within a spatial context, information visualization does not have these
constraints. When information visualizations use shape, the visualizations
tend to use simple shapes or icons to represent a single data attribute,
possibly in combination with other non-shape visual attributes [Bor13].
However, some novel techniques using shape have been explored. For
example (Fig. 3.8):
Chernoff Faces
represent multiple features through the use of simple
shapes assembled into compound glyphs which resemble familiar objects,
i.e. faces. While the effectiveness and proper use of Chernoff faces is
debated, it should be noted that the Chernoff face combines multiple shape
attributes together combining attributes such as eye size, eyebrow angle,
and mouth openness to create a single glyph of a face.
Physical Objects
used as markers on a scatterplot, such as geographic
regions or animals, (e.g. [Woo98], [Tuf96]), rely on the unique shapes of
these entities as identifiers. However, these shape features are inherent in
the objects - not data-driven attributes. Furthermore, the effectiveness of
Search WWH ::

Custom Search