Biomedical Engineering Reference
In-Depth Information
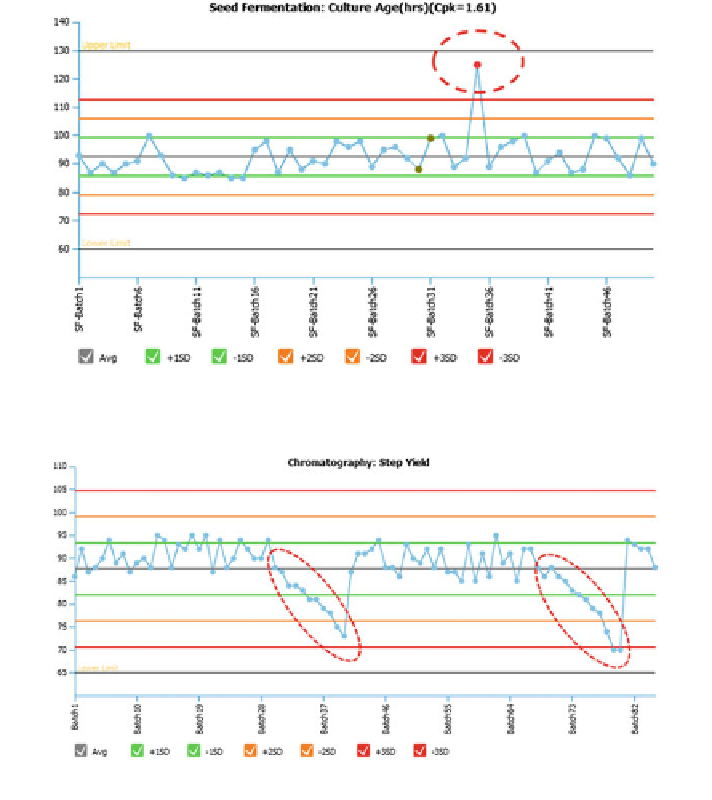
Fig. 22
Statistical process control chart for a seed culture process parameter
Fig. 23
Statistical process control chart of % step yield of a chromatography process
4.2 Case Study 2: Process Improvement
During another process review, a cyclic trend of gradual decrease in step yields
after 30 batches was observed for a chromatography step in the process (Fig.
23
).
As shown in the control chart (Fig.
23
), yields returned to normal after every 40
batches.
Plotting the step yields against the number of column cycles (Fig.
24
) clearly
differentiated the batches processed with the same column pack up to 30 cycles
from those processed after 30 cycles. Also, the host cell DNA (HCD) was plotted
using the marker size, clearly indicating a loss in column performance for columns
used after 30 cycles, as indicated by a loss in yield and increase in output HCD
Search WWH ::

Custom Search