Geography Reference
In-Depth Information
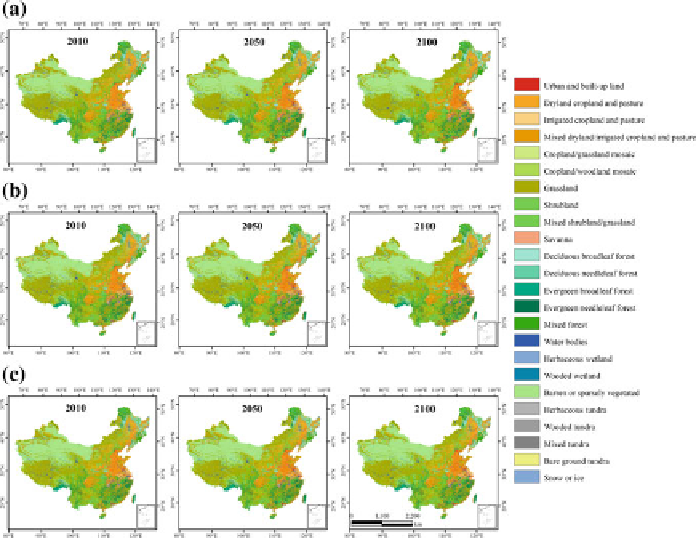
Fig. 3.8 Simulated spatial pattern of LUCC in China in 2010, 2050 and 2100 under the Business
as Usual scenario (a), Rapid Economic Growth scenario (b) and Cooperate Environmental
Sustainability scenario (c)
0.15 and 0.08 million ha, respectively. Under the REG scenario the
increasing trend of built-up area tends to be rapid on the whole during
2010-2100, with the 10-year increasing rate reaching 0.5 million ha and the
total area of built-up area reaching 5.05 million ha. By contrast, cropland and
water area both show a decreasing trend under all the three scenarios, espe-
cially the REG scenario, under which their 10-year decreasing rates reach
0.23 and 1.28 %, respectively. Under the BAU scenario and CES scenario,
the change of these two land cover types tends to slow down, with their 10-
year decreasing rates reaching 0.19 and 0.15 %, 1.17 and 1.03 %, respec-
tively. The increase of forestry area reaches to 19.77, 17.74 and 22.79 million
ha under the BAU scenario, REG scenario and CES scenario, respectively.
While, the changes of grassland under the BAU scenario, REG scenario and
CES scenario show a decreasing trend with the rates of 3.12, 2.67 and 3.80 %,
respectively.
(ii)
The spatial pattern of land use/cover change. The simulation results indi-
cated that the spatial patterns of land cover in China under the three sce-
narios are consistent on the whole, but with some regional difference
(Fig.
3.8
). The spatial pattern of land cover in China in the future is as