Biomedical Engineering Reference
In-Depth Information
8
0.8
7
0.7
6
0.6
5
0.5
4
0.4
3
0.3
2
0.2
1
0.1
0
0.0
0
2
4
6
8
10
12
14
16
18
20
Time, h
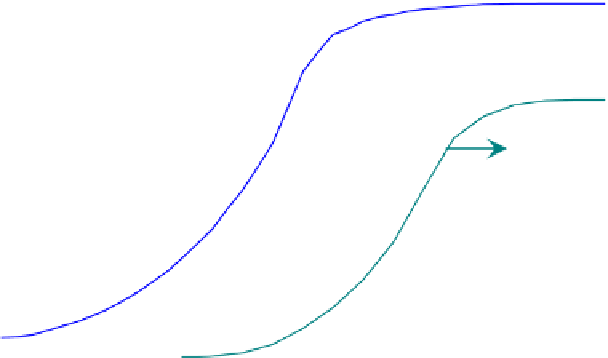
FIGURE E12-3.1
Biomass concentration and the concentration of a secondary metabolite in a batch culture.
Mass balance of the secondary metabolite
P
over the
i
th chemostat at steady state gives:
QP
i1
QP
i
þ r
Pi
V
i
¼ 0
(E12-3.3)
Dividing through by
V
i
, we obtain
r
Pi
¼ D
i
ðP
i
P
i1
Þ (E12-3.4)
Eqns (E12-3.4)
and
(E12-3.2)
are similar, in that the rate of formation of the secondary metab-
olite is a straight line on the rate vs concentration plane passing through the feed point
(
P
¼
P
i
1
,
r
P
¼
0) with a slope of D
i
, intercepts with the fermentation rate curve at (
P
¼
P
i
,
r
P
¼
r
P
i
). Therefore, if the rate functions are known, one can solve the problem easily (as
we have been doing). Alternatively, we can solve the problem graphically based on the prop-
erty as mentioned.
Therefore, to solve the problem, we must produce the rate curves. For the batch data, there
were minimum measurements available: only the concentrations of biomass and product
change with time. Fortunately, this is enough to produce the rate curves. In batch operations,
mass balance yields
d
C
j
d
r
j
¼
(E12-3.5)
t
Thus, the rate of production can be obtained by differentiating the concentration curve (either
measure the slopes of tangential lines or via central difference). These curves are shown in
Figs E12-3.2 and E12-3.3
. The quality or smoothness of the curves in
Figs E12-3.2
and
E12-3.3
is noticeably poor, which is due to the differentiation of data. The error in the data
is magnified and distorted because of the differentiation (see Chapter 7).


Search WWH ::

Custom Search