Biomedical Engineering Reference
In-Depth Information
1.6
1.4
1.2
1.0
0.8
0.6
0.4
0.2
0.0
0
1
2
3
4
5
6
7
8
X
, g/l
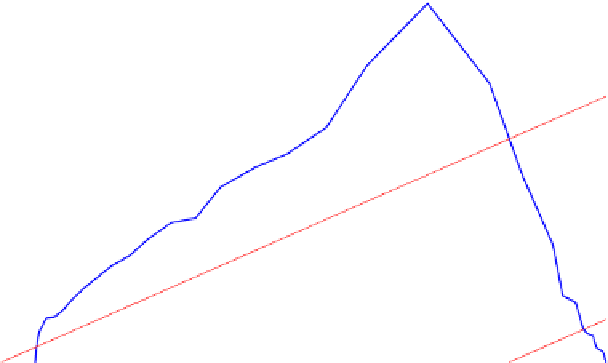
FIGURE E12-3.2
Rate of production of biomass based on the batch fermentation data.
0.15 h
1
.
Figure E12-3.2
shows the solutions of biomass. We overlay the mass balance,
Eqn (E12-
3.2)
on top of the rate curve obtained from
Fig. E12-3.1
. In the feed to the first reactor, the
medium is sterile (
X
0
¼
120/800 h
1
(a) Two chemostats of equal volume in series. D
1
¼
D
2
¼
¼
0). The two lines all have slopes of 0.15/h. The intercepts occur at
the biomass concentration of
X
1
¼
6.72 g/L and
X
2
¼
7.70 g/L. We ignored the one of the
two intercepts for the first reactor,
X
1
¼
0.45 g/L. The reason is that this is the starting
condition for the batch data where lag phase present. In chemostat operation, this point is
easily avoided by stating the withdrawing of culture after the biomass growth
established.
We next compute the concentration of the secondary metabolite. At this point, one may use
the values of biomass concentration obtained already and read off corresponding values of
secondary metabolite concentration from
Fig. E12-3.1
since the medium is identical. If we
did that, we obtain
P
1
¼
0.079 g/L and
P
2
¼
0.23 g/L. We know that the feed to the first
reactor
P
0
¼
0. Clearly, these three values of
P
do not satisfy
Eqn (E12-3.4)
and the secondary
metabolite rate data in
Fig. E12-3.3
. If we use the rate data in
Fig. E12-3.3
and
Eqn (E12-3.4)
,
we would get a different set of values of
P
. Which one is correct?
The batch data did not give the substrate concentration nor we know the stoichiometry.
This is a drawback. We know that for the secondary metabolite to be produced, there must
be 1) large quantity of cell biomass and 2) one of more of the key growth-required substrate
concentration is low. Therefore, the first reactor is not really producing secondary metabolite
as the substrates are all in excess and there is no cell biomass in the feed. Therefore, the value
of
P
1
is correct as it reads off from
Fig. E12-3.1
. However, the rate of formation of secondary
metabolite does agree with that of the intercept of
Eqn (E12-3.4)
and the curve in
Fig. E12-3.3
.


Search WWH ::

Custom Search