Biomedical Engineering Reference
In-Depth Information
(a)
(b)
10
10
9
9
C
A
8
C
A
8
7
7
6
6
5
5
4
4
3
3
C
B
2
2
1
1
C
B
0
0
0123456789 0
0.0
0.2
0.4
0.6
0.8
1.0
k
S
t
k
S
t
(c)
(d)
1.0
1.0
0.9
0.9
0.8
0.8
A
0.7
0.7
0.6
0.6
A
j
j
0.5
0.5
0.4
0.4
B
0.3
0.3
0.2
0.2
0.1
0.1
B
0.0
0.0
0.0
0.2
0.4
0.6
0.8
1.0
0123456789 0
k
S
t
k
S
t
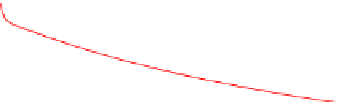
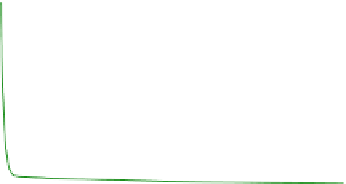
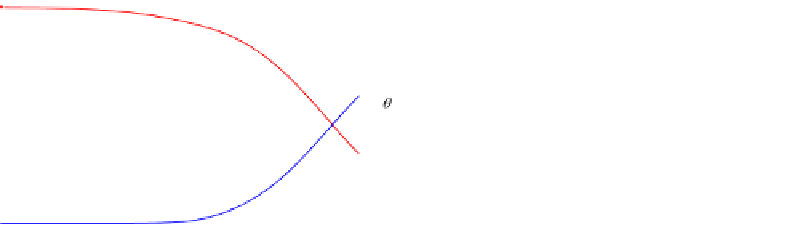
FIGURE E9-4.4
Variations of concentrations in the bulk phase (a, b) and surface coverages (c, d) as functions of
time for
k
A
C
s
¼
k
S
;
K
A
¼
1/
C
s
;
K
C
¼
4;
K
B
¼
1/
C
s
; and
k
B
C
s
¼
10
k
S
.
(a)
(b)
10
1.0
9
0.9
C
A
8
0.8
7
0.7
6
0.6
j
5
0.5
4
0.4
A
3
0.3
2
0.2
B
1
C
B
0.1
0
0.0
0.01
0.1
1
10
100
0.01
0.1
1
10
100
k
S
t
k
S
t
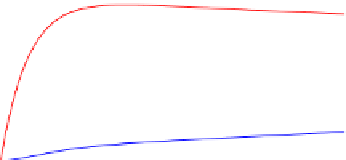
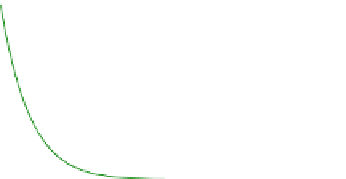
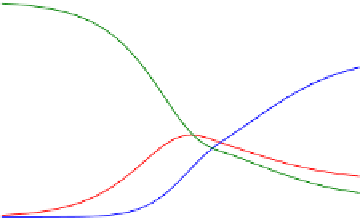
FIGURE E9-4.5
Variations of concentrations in the bulk phase (a) and surface coverages (b) for
k
A
C
s
¼
0.1
k
S
;
K
A
¼
1/
C
s
;
K
C
¼
4;
K
B
¼
1/
C
s
; and
k
B
C
s
¼
k
S
.


Search WWH ::

Custom Search