Biomedical Engineering Reference
In-Depth Information
1.0
(a)
10
(b)
0.9
9
0.8
8
C
A
7
0.7
A
0.6
6
0.5
5
4
0.4
0.3
3
B
C
B
0.2
2
1
0.1
0
0.0
0123456789 0
0123456789 0
k
S
t
k
S
t
(c)
10
(d)
1.0
9
0.9
C
A
0.8
8
7
0.7
A
6
0.6
j
5
0.5
0.4
4
3
0.3
B
2
0.2
1
C
B
0.1
0
0.0
0.01
0.1
1
10
100
0.01
0.1
1
10
100
k
S
t
k
S
t
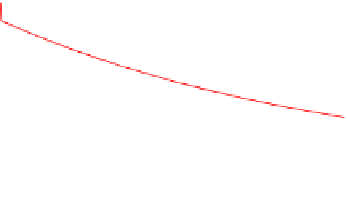
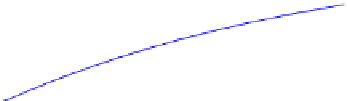
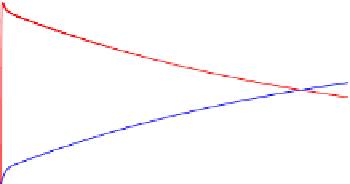
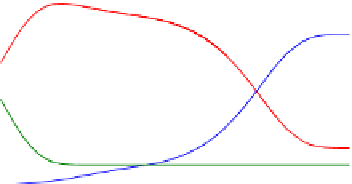
FIGURE E9-4.3
Variations of concentrations in the bulk phase (a, c), and surface coverages (b, d) as functions of
time for
k
A
C
s
¼
10
k
S
;
K
A
¼
1/
C
s
;
K
C
¼
4;
K
B
¼
1/
C
s
; and
k
B
C
s
¼
10
k
S
.
We then examine the case when adsorption of A is the rate-limiting step as shown in
Fig. E9-4.5
. In this case, the decrease in
C
A
initially is not as apparent as the previous two
cases. The increase in the concentration of B in the bulk phase showed almost a “delay.”
Therefore, the effect of adsorption is still important.
The effects of catalyst and adsorption on the concentrations of reactants and products
are important if there are significant amount of catalysts being added for batch systems.
Therefore, once we perform LHHW analysis, we need to take the adsorption into
consideration.
b) LHHW approximation
We next use the LHHWassumption to examine one case: the surface rate-limiting case to
see how LHHWapproximates the first we have discussed in this example. If the surface reac-
tion is the rate-limiting step, we have the overall rate for reaction
(E9-4.4)
:
r ¼ r
2
¼ k
S
C
s
q
A
k
S
C
s
q
B
(E9-4.16)
The other two steps
(E9-4.3) and (E9-4.5)
are in equilibrium,
0
¼ r
1
¼ k
A
C
A
qC
s
k
A
q
A
C
s
(E9-4.17)
0
¼ r
3
¼ k
B
q
B
C
s
k
B
C
B
qC
s
(E9-4.18)


Search WWH ::

Custom Search