Biomedical Engineering Reference
In-Depth Information
Q, S
0
Q, S
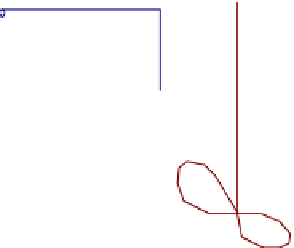
FIGURE 8-4.2
A schematic of a CSTR.
r
S
n
r
P
n
From stoichiometry,
¼
. Thus
S
P
QS
0
QS
V
¼ Dð
r
P
¼r
S
¼
S
0
S
Þ
(E8-4.13)
D ¼ Q=V ¼ 15=5000=min ¼ 310
3
min
1
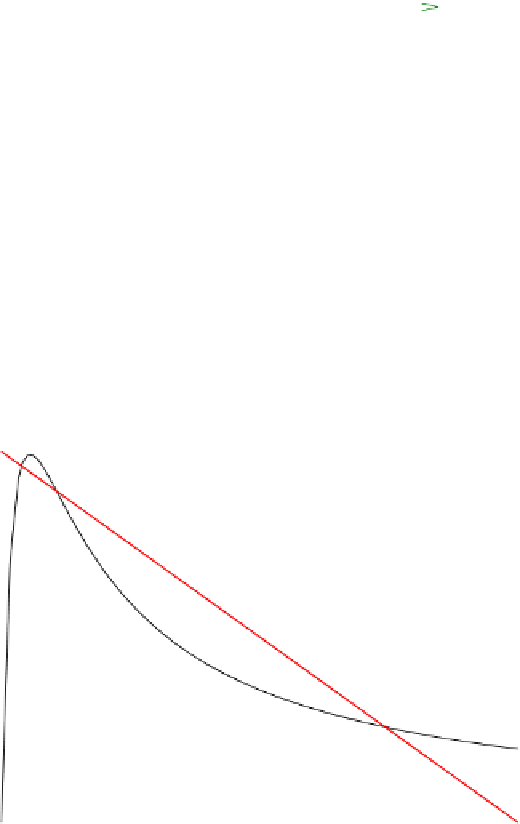
Therefore, the mole balance Eqn
(E8-4.13)
is a straight line on the (S, r
P
) plane with a negative
slope of
10
3
min
1
) and intercept on the S-axis of S
0
¼
D (
3
60 mmol/L. Plot the mole
balance line (red line) on to the
Fig. 8-4.1
yields
Fig. 8-4.3
.
0.20
0.18
0.16
0.14
0.12
0.10
0.08
0.06
0.04
0.02
0.00
0
10
20
30
40
50
60
S
, mmol/L
FIGURE 8-4.3


Search WWH ::

Custom Search