Biomedical Engineering Reference
In-Depth Information
(a)
F
A0
Q
A
C
A0
Q
Q
,
f
Ae
C
B0
C
Ae
,
C
Be
F
B0
Q
B
(b)
F
B0
Q
B
C
B0
Q
0
Q
,
f
Ae
C
A
C
Be
,
C
A
A0
Q
A
(c)
F
A0
Q
A
C
A0
Q
0
Q
,
f
Ae
C
B
C
Ae
,
C
B
B0
Q
B
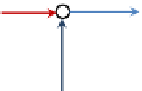
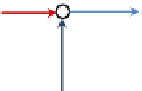
FIGURE 5.16
Selected feed schemes for a two reactant systems in PFR. (a) Feeding both A and B at the beginning.
(b) Feeding B at the beginning, while maintaining
C
A
constant by adjusting the feed distributed along the reactor.
(c) Feeding A at the beginning, while maintaining
C
B
constant by adjusting the feed distributed along the reactor.
For 90% conversion of A, find the concentration of R in the product stream as a function
of the reaction rate constants. Equal volumetric flow rates of the A and of the B streams
are fed to the reactor, and each stream has a concentration of 20 mol/L of the said reactant.
Therateparametersare:
k
1
¼
0.1 mol
1/2
$
L
1/2
$
min
1
;
k
2
¼
0.2 min
1
;
K
A
¼
10 mol
1
$
L;
5mol
1/2
$
L
1/2
. The flow in the reactor follows:
and
K
B
¼
1. PFR;
2. CSTR;
3. The best of the three PFR contacting (feeding) schemes in
Fig. 5.16
.
Solution. As a warning, be careful to get the concentrations and flow rates right when you
mix the streams. To begin with, we find the differential selectivity of the desired product
d
F
A
j
due to the formation of R
d
F
A
j
total
r
1
A
k
1
C
A
k
1
C
A
þ k
2
C
1=2
s
R
=
A
¼
¼
r
1
A
þ r
2
A
¼
(E5-7.3)
B
One can solve the problem by performing mole balances on each species and solve the differ-
ential equations using an automatic integrator. We can also do it more illustrative by using the
differential selectivity as defined by
Eqn (E5-7.3)
. This is the approach we will be taking here.
1. PFR. Referring to
Fig. 5.16
a, noting that the starting concentration of each reactant in
the combined feed is
C
A0
¼
C
B0
¼
20 mol/L
O
2
¼
10 mol/L. Based on the stoichiometry,


Search WWH ::

Custom Search